HERE STUDIO /
Map Analytical Tool
This one is special
Project Scope:
Redesign
Team Size:
1 Design Intern, 1 Lead, 3 Dev, 1 PM
Duration:
5 Months
Platform:
Desktop Web

© Summary सारांश
User Metrics
Outcome
Here is how the final solution moved the needle for the business
Retention
Adoption
Engagement
Task Time
© Introduction परिचय
HERE Technologies
Introduction

HERE Studio
HERE Studio (formerly Here XYZ) was a no-code tool from HERE Technologies for building and sharing interactive maps in the browser. During my internship, an early conversation with my mentor about the product's rough edges pointed us at its interface especially since HERE had just launched LUI 2.0, a new design language the tool hadn't adopted yet. My brief: find what wasn't working, and rebuild it in LUI 2.0.
HERE Studio
HERE Studio (formerly Here XYZ) was a no-code tool from HERE Technologies for building and sharing interactive maps in the browser. During my internship, an early conversation with my mentor about the product's rough edges pointed us at its interface especially since HERE had just launched LUI 2.0, a new design language the tool hadn't adopted yet. My brief: find what wasn't working, and rebuild it in LUI 2.0.
© Challenge चुनौती
to overcome
The Objective

The objective had two layers. On the surface, the task was to migrate HERE Studio to LUI 2.0 the design language HERE had introduced only a few months earlier so the product would finally look and feel consistent with the rest of the catalogue. But a restyle alone would have wasted the opportunity. The real goal was to use that transition to fix the problems underneath: simplify how people work with layers and data, cut the redundancy across screens, and turn an empty, unguided first-run into something that actually helps a new user get started. In short not just make HERE Studio look like a HERE product, but make it work like one.
© User Research अनुसंधान
Custom Quotes
Approach
I worked through the project in five phases:
Analysis
Research
Benchmarking
Implementation
Testing.
I began by auditing the existing product screen by screen to map where it fell short. I then moved into research gathering input from HERE's own front-end team and from the people who actually use tools like this before bench-marking HERE Studio against its closest competitors to see where it stood. With a clear picture of both the problems and the landscape, moved into implementation, building from information architecture through low- and high-fidelity designs, and finally tested the result with users to see whether it held up. Each phase fed the next, so the final design was grounded in evidence rather than assumption.
© Ideation विचार
Thinking
Analysis

Confusing
(These are 2 separate buttons)
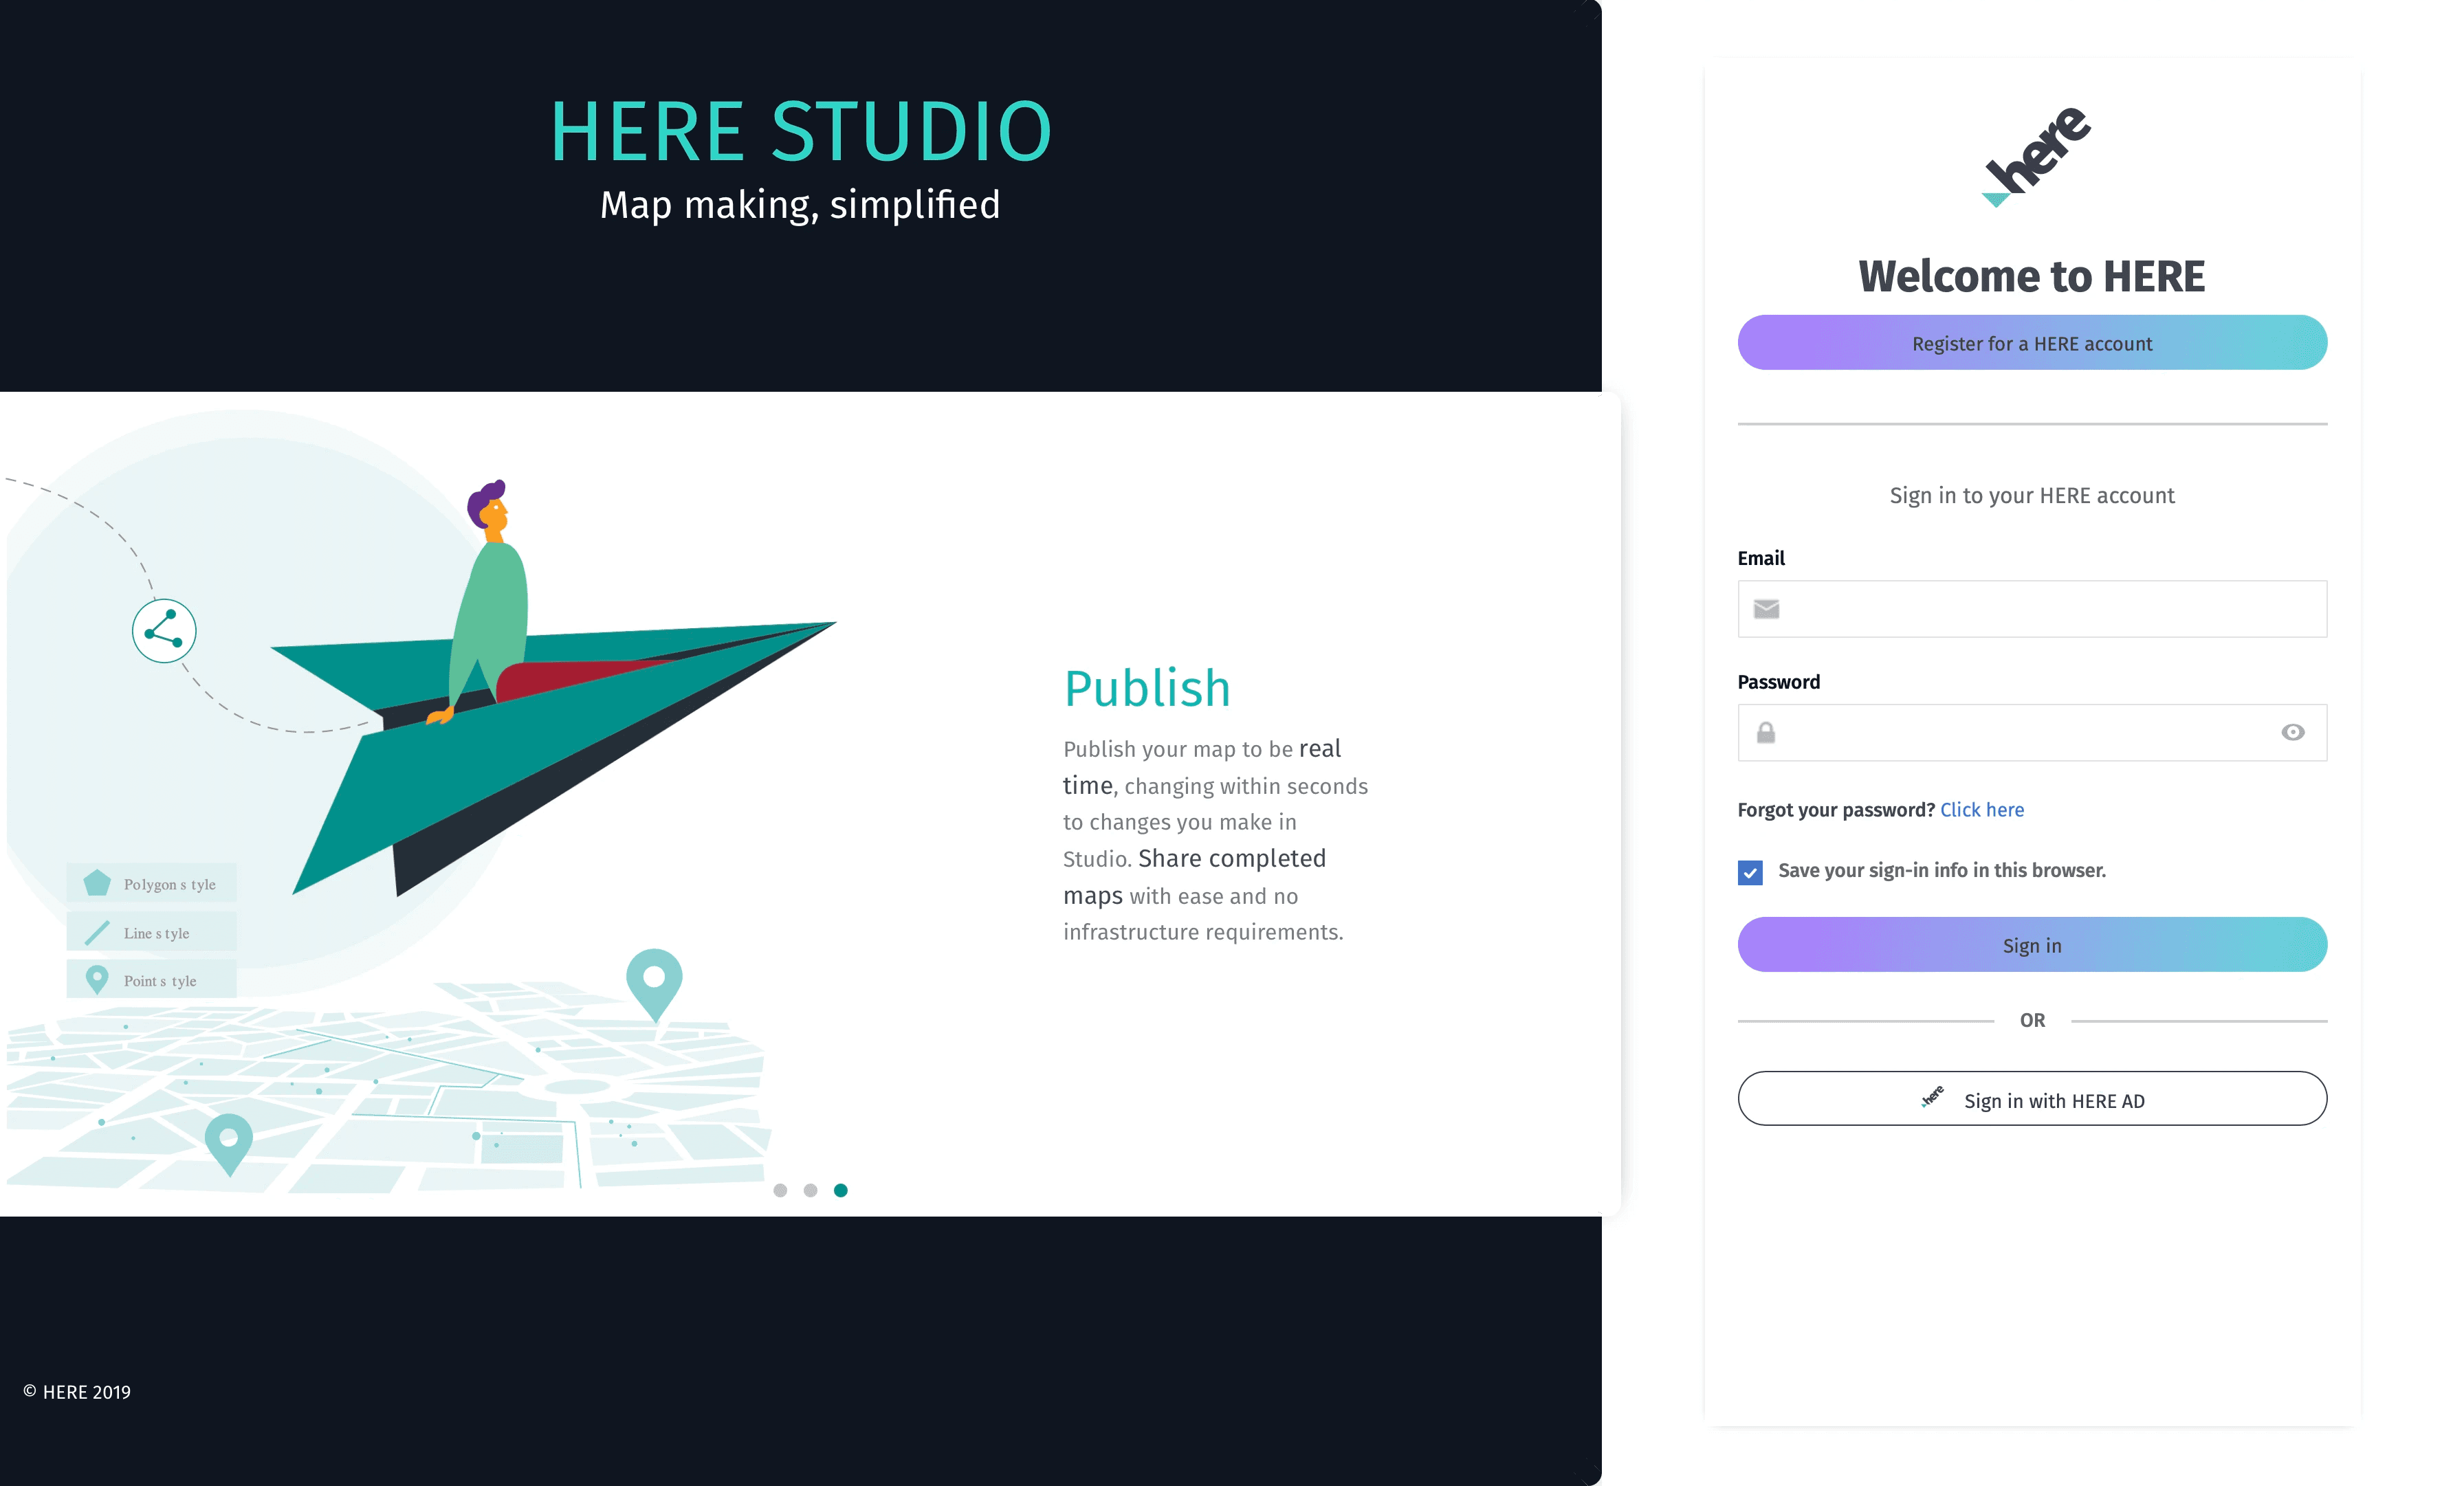
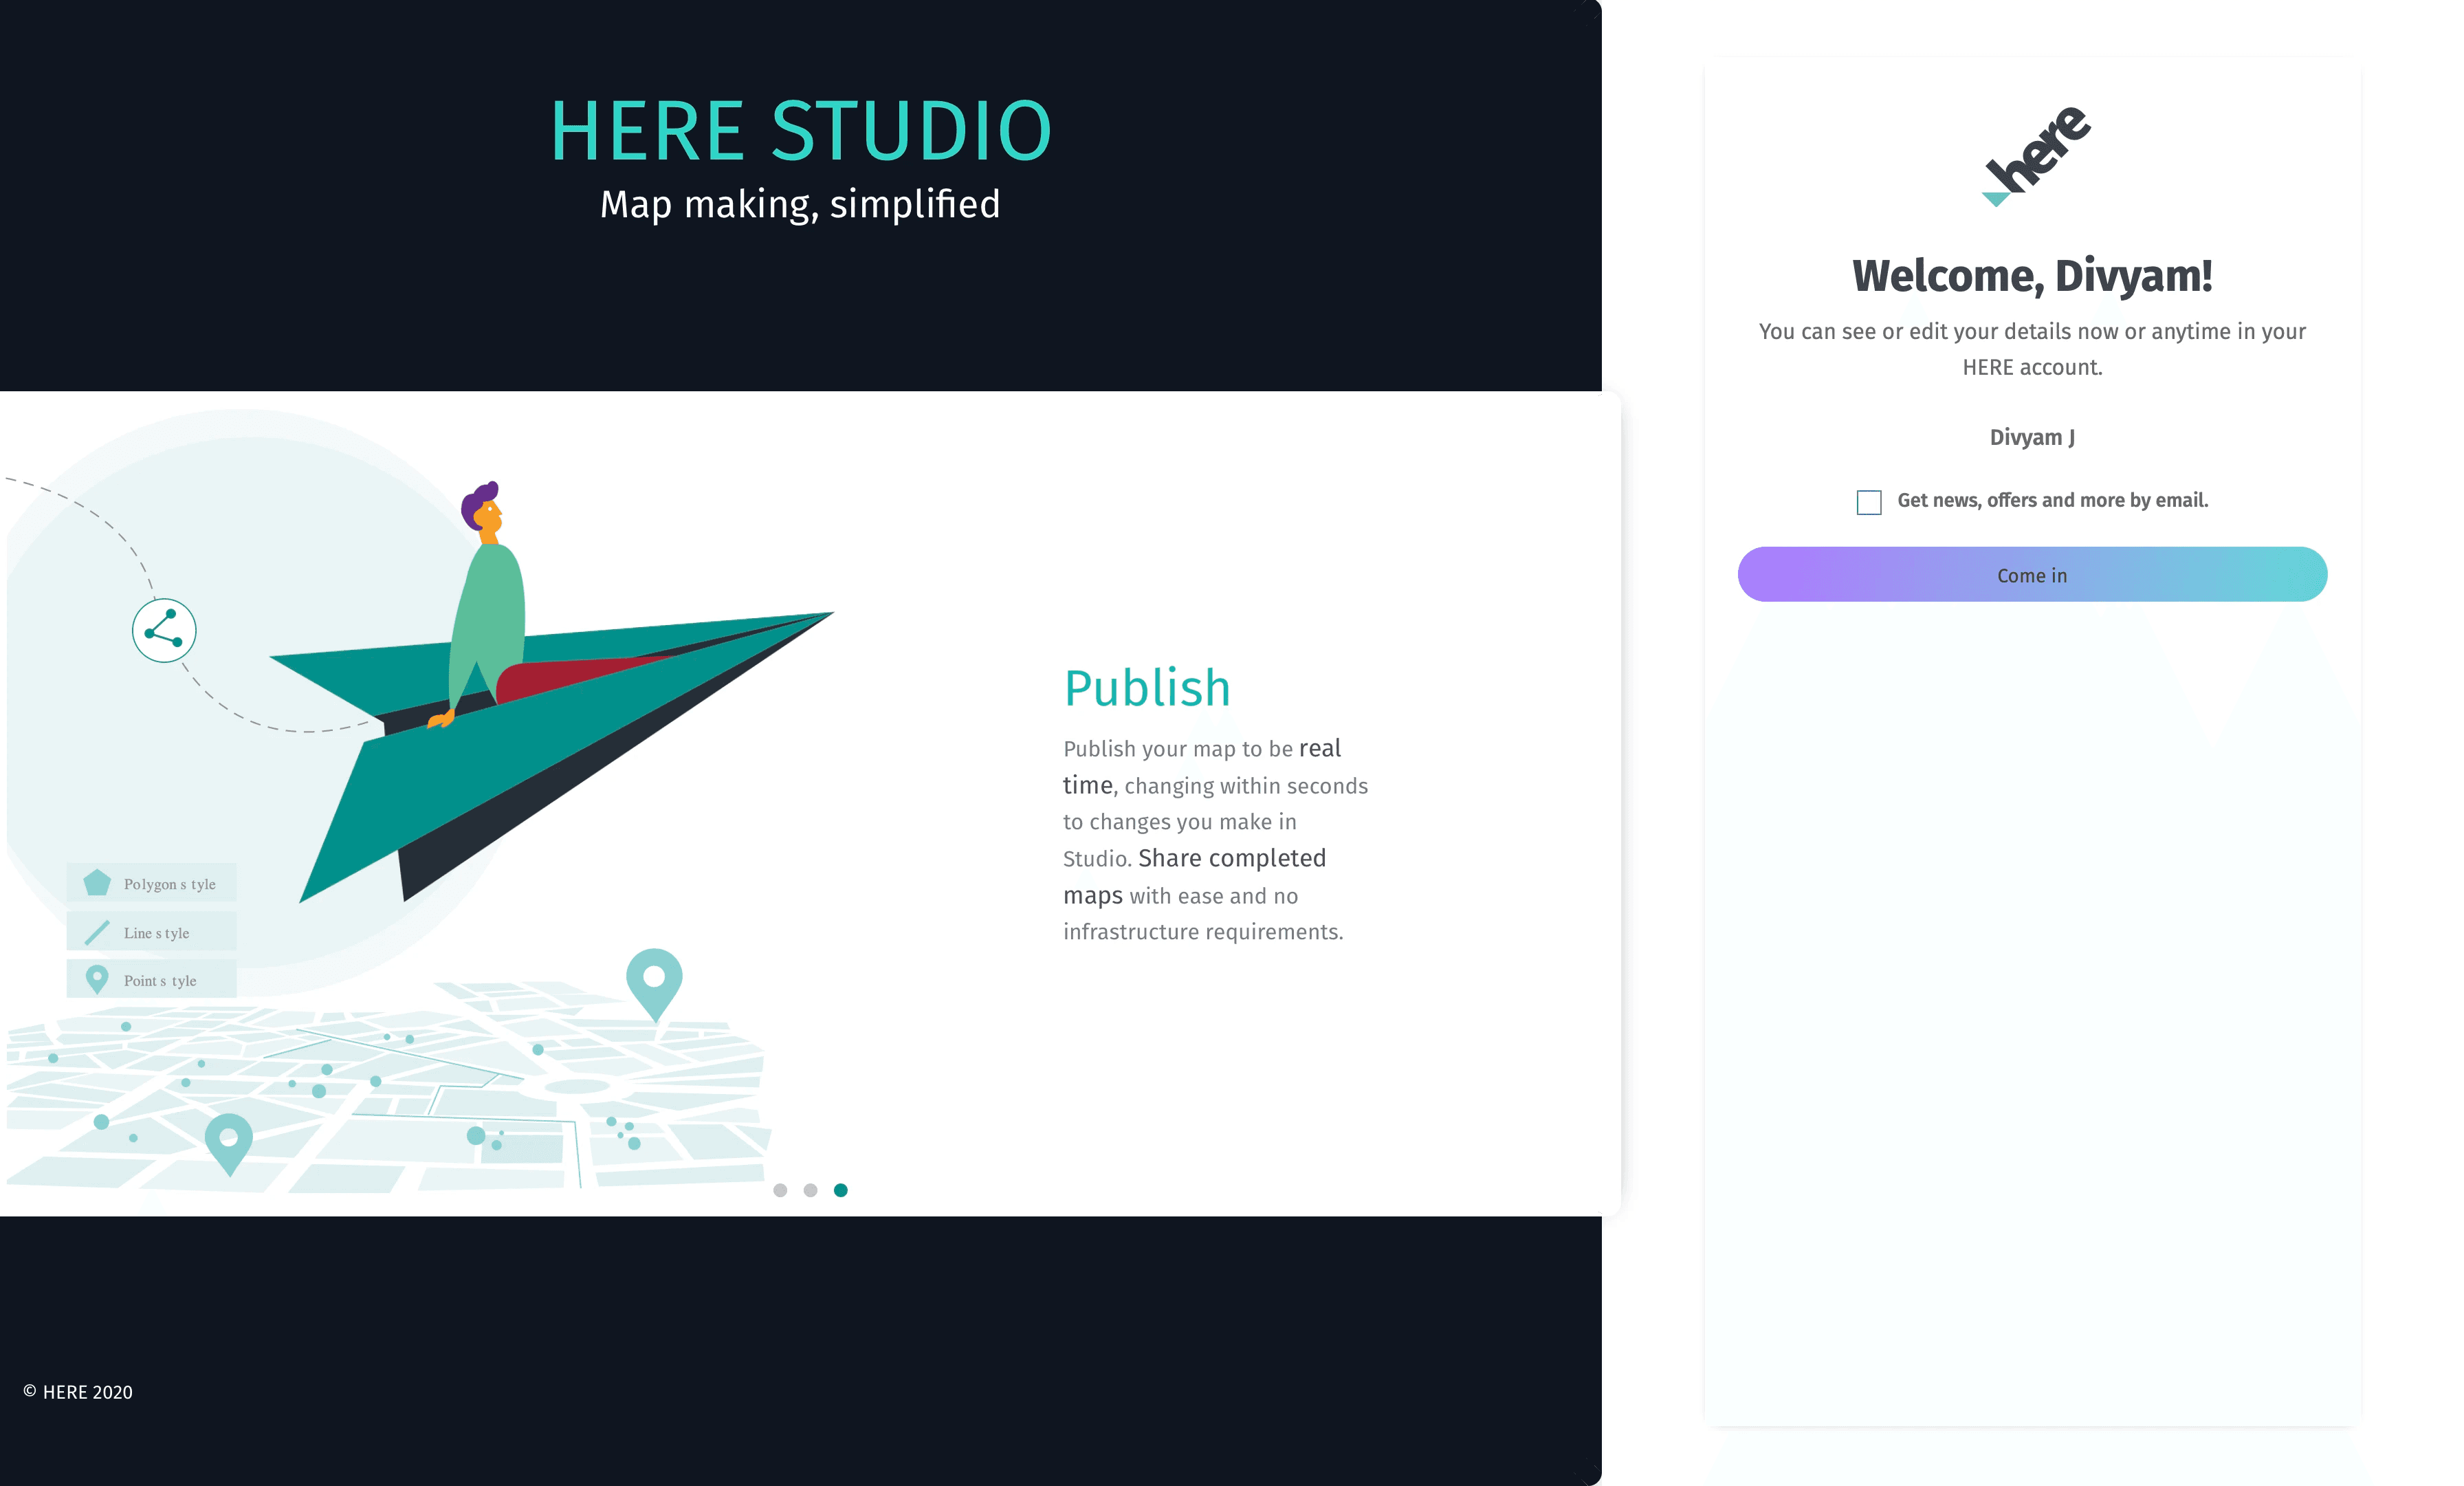
I started by walking through HERE Studio exactly as a new user would, screen by screen, noting everything that created friction.
The sign-in screen made a reasonable first impression it followed HERE's newer guidelines and creating an account was easy but the buttons were stretched far wider than they needed to be.
One of the two sign-in options was reserved for HERE employees without that being obvious.
Past sign-in, the project dashboard left large areas of negative space unused and split simple actions, like switching layouts, across separate controls.
The core map workspace was where the real problems lived. The left-hand control panel had the right idea surfacing only the options relevant at a given moment, with changes on the panel reflected live on the map but the placement of key actions like Layer and +Data was genuinely confusing.
Data uploads were quietly limited to certain file formats. The data section compounded this, the same information was repeated across three different tables in three different formats, and the interface mixed dark and light themes inconsistently.
Individually these were small things; together they made a capable tool harder to use than it needed to be.
© Comparison तुलना
5 Tools
Competitor
Analysis

Number Of Clicks
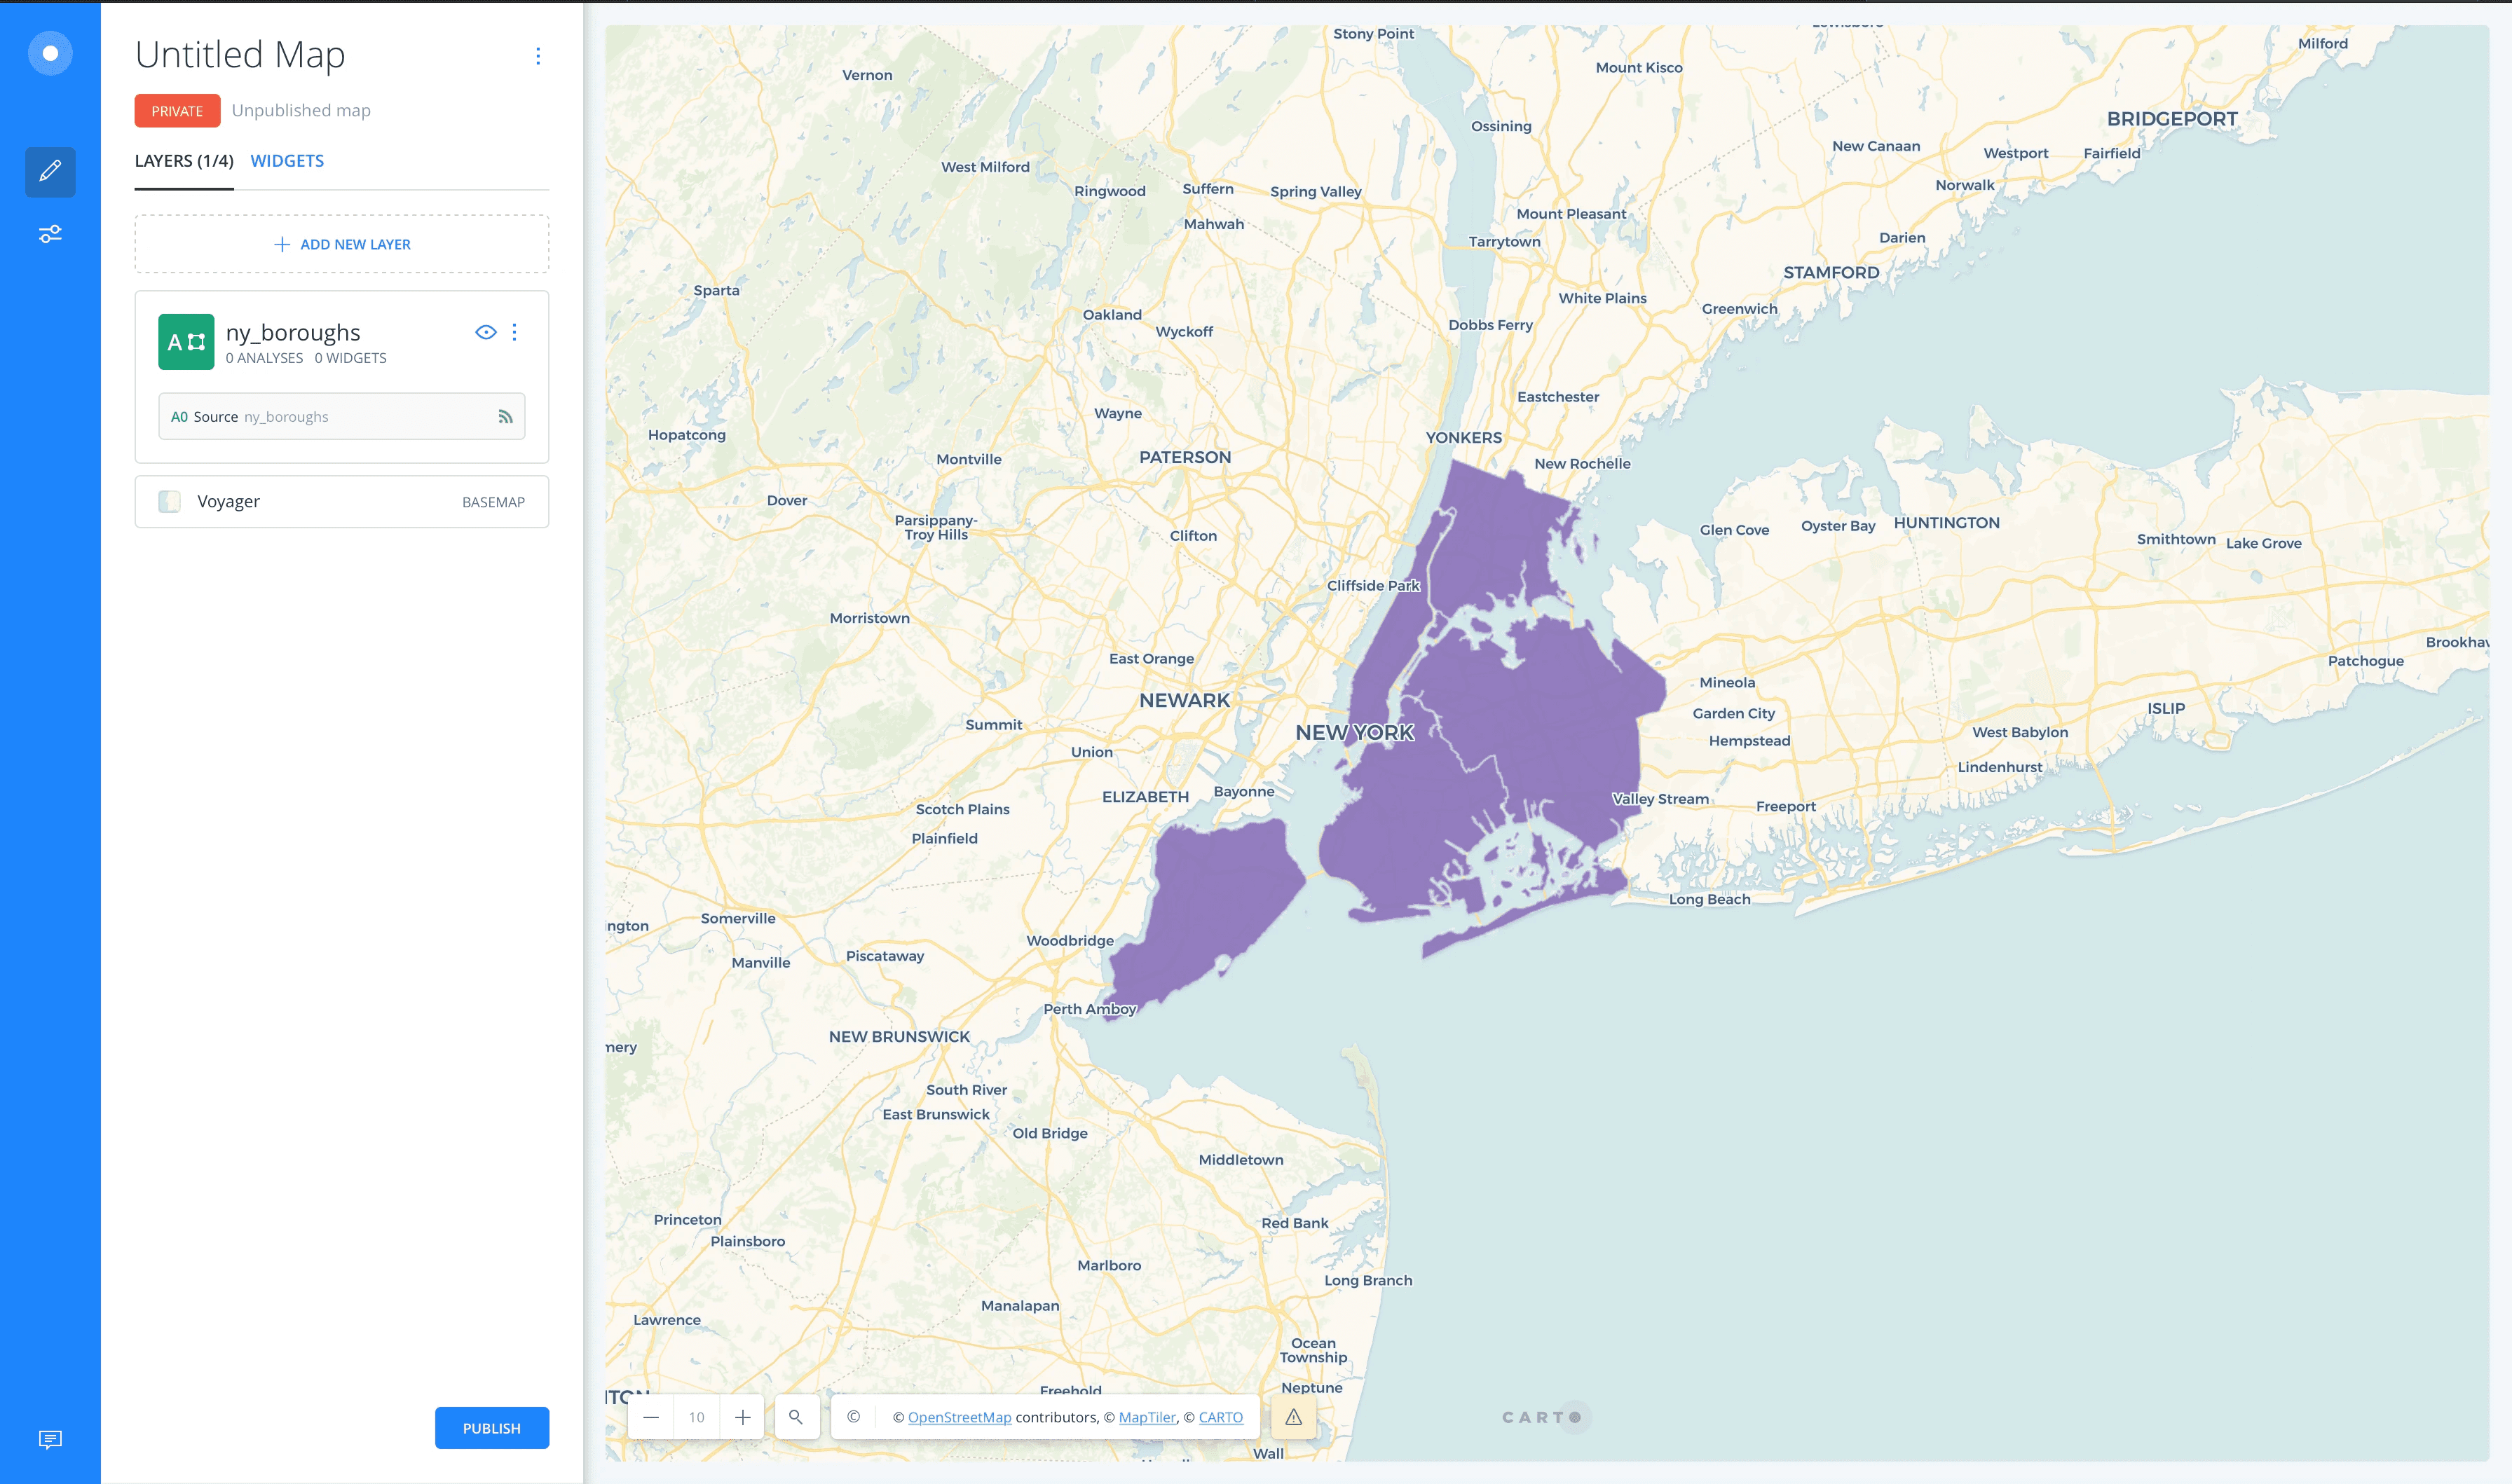
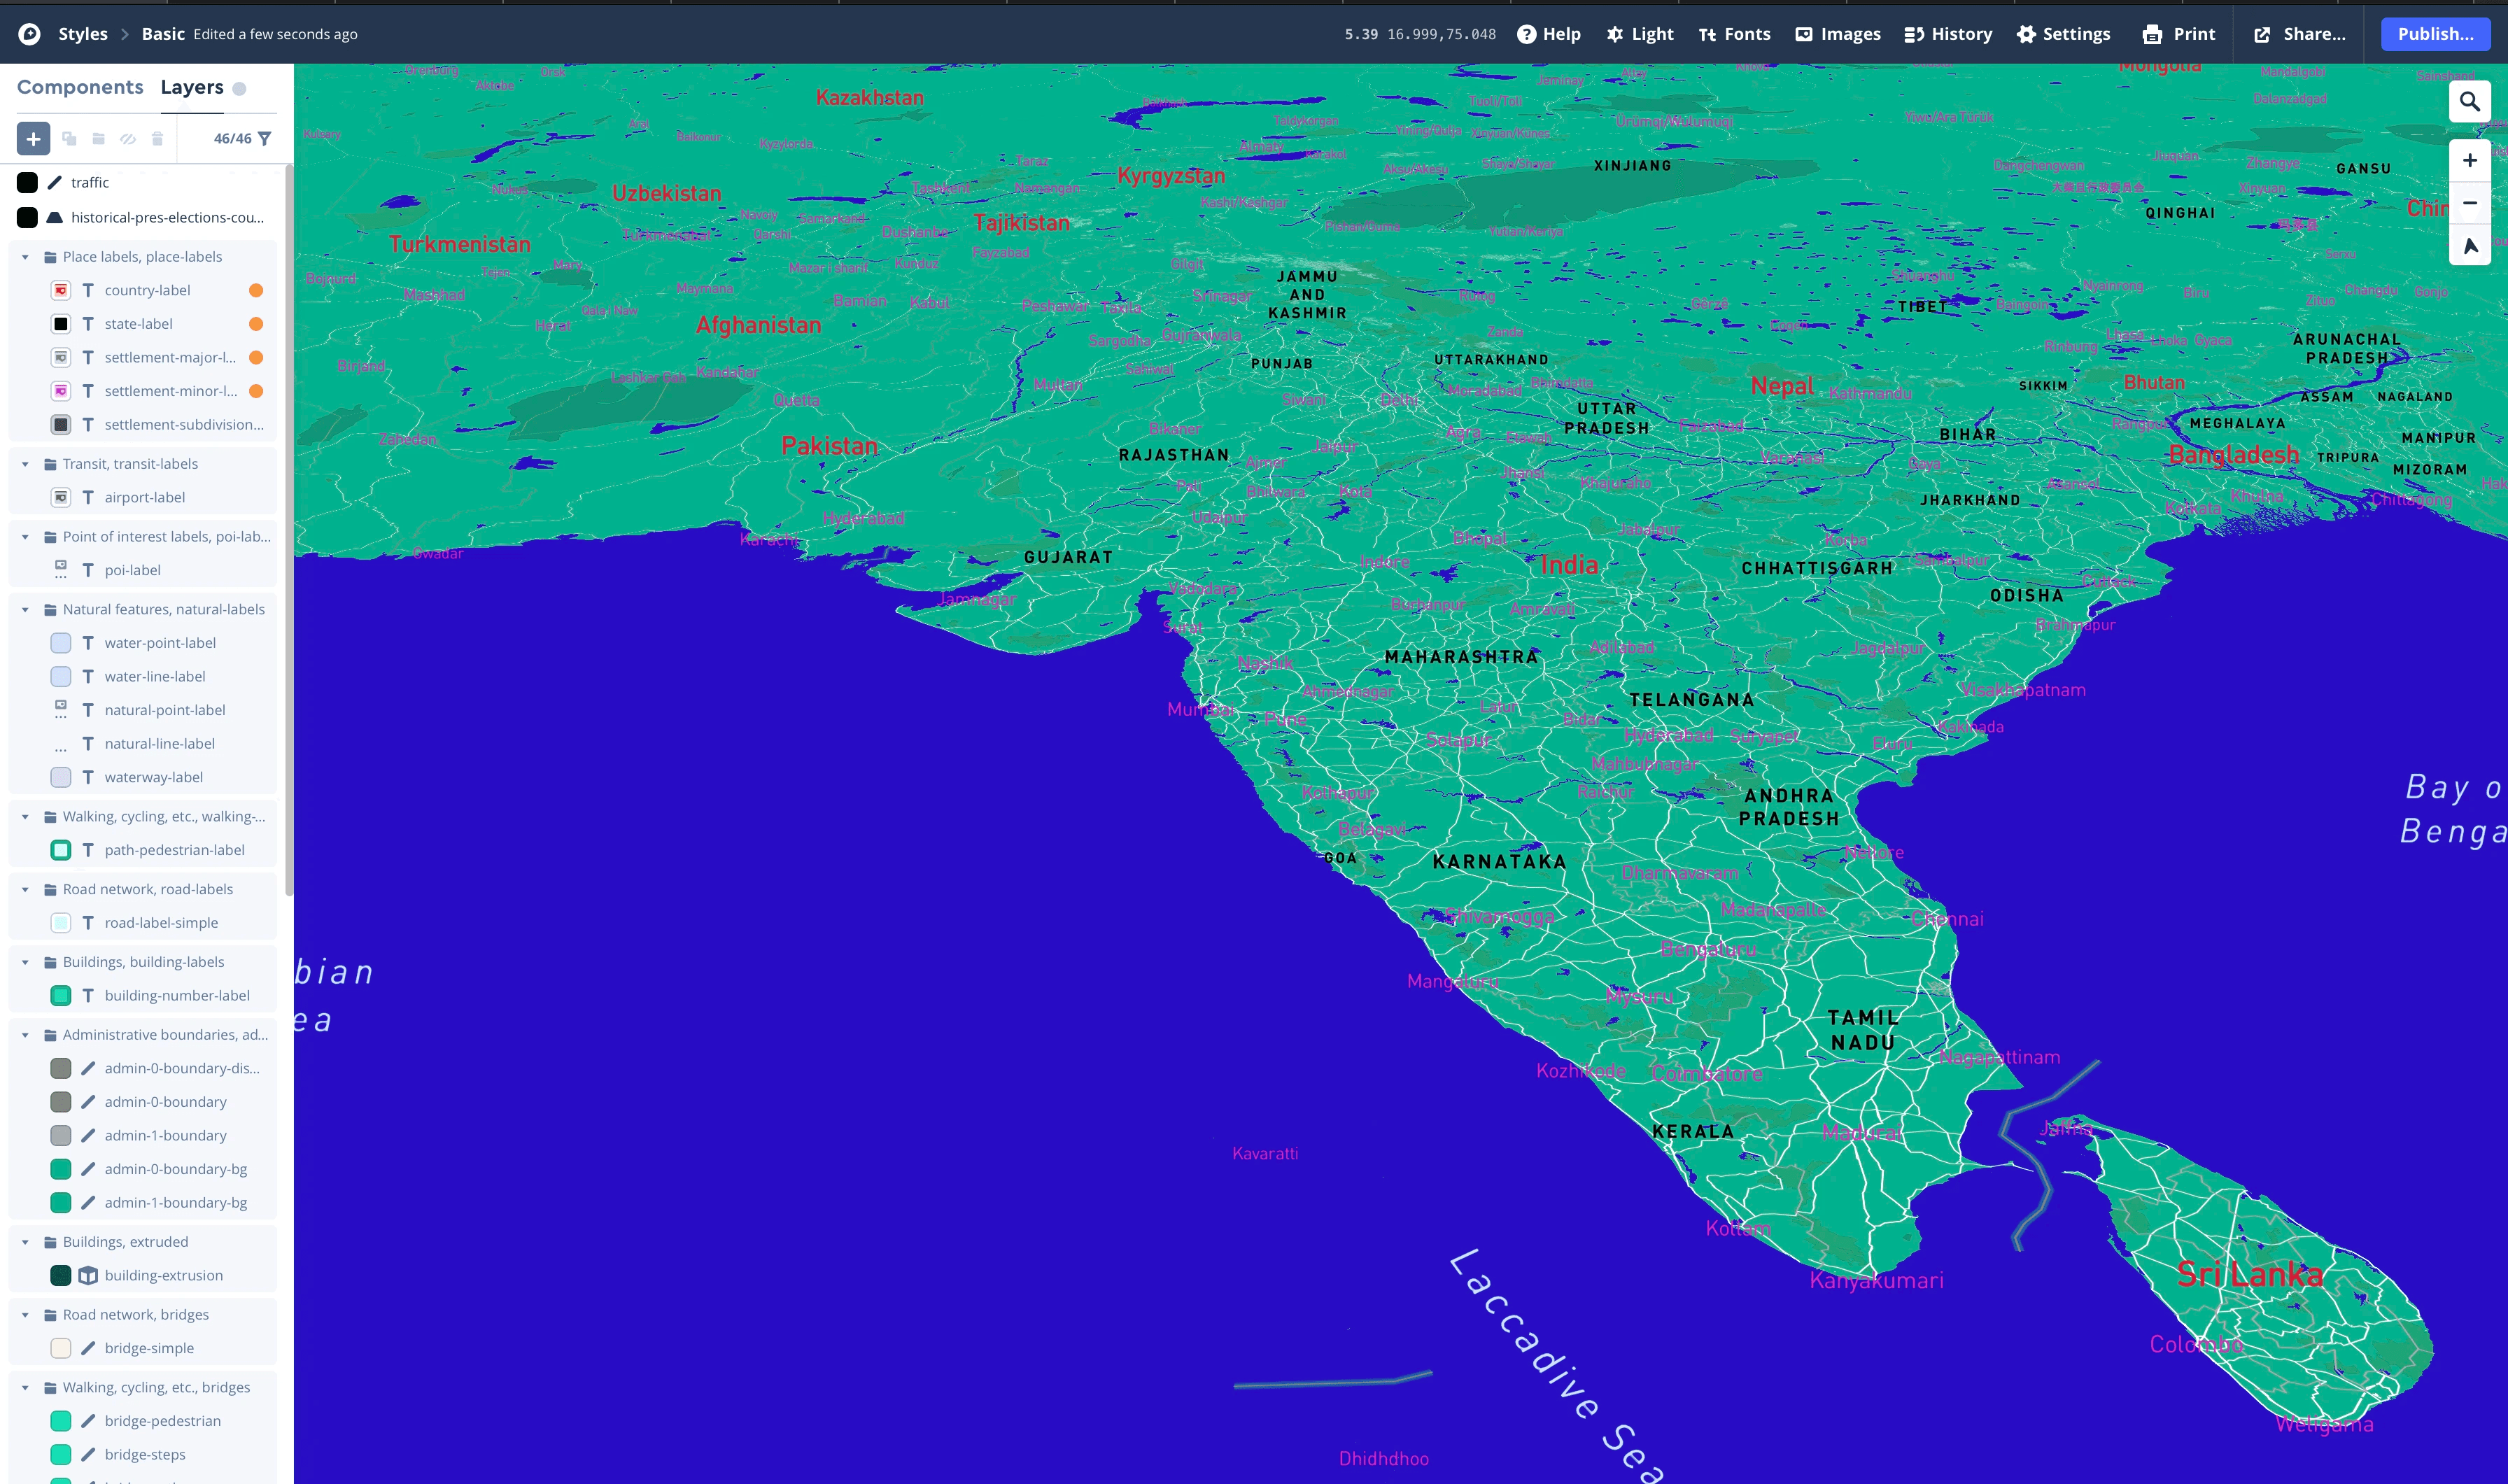
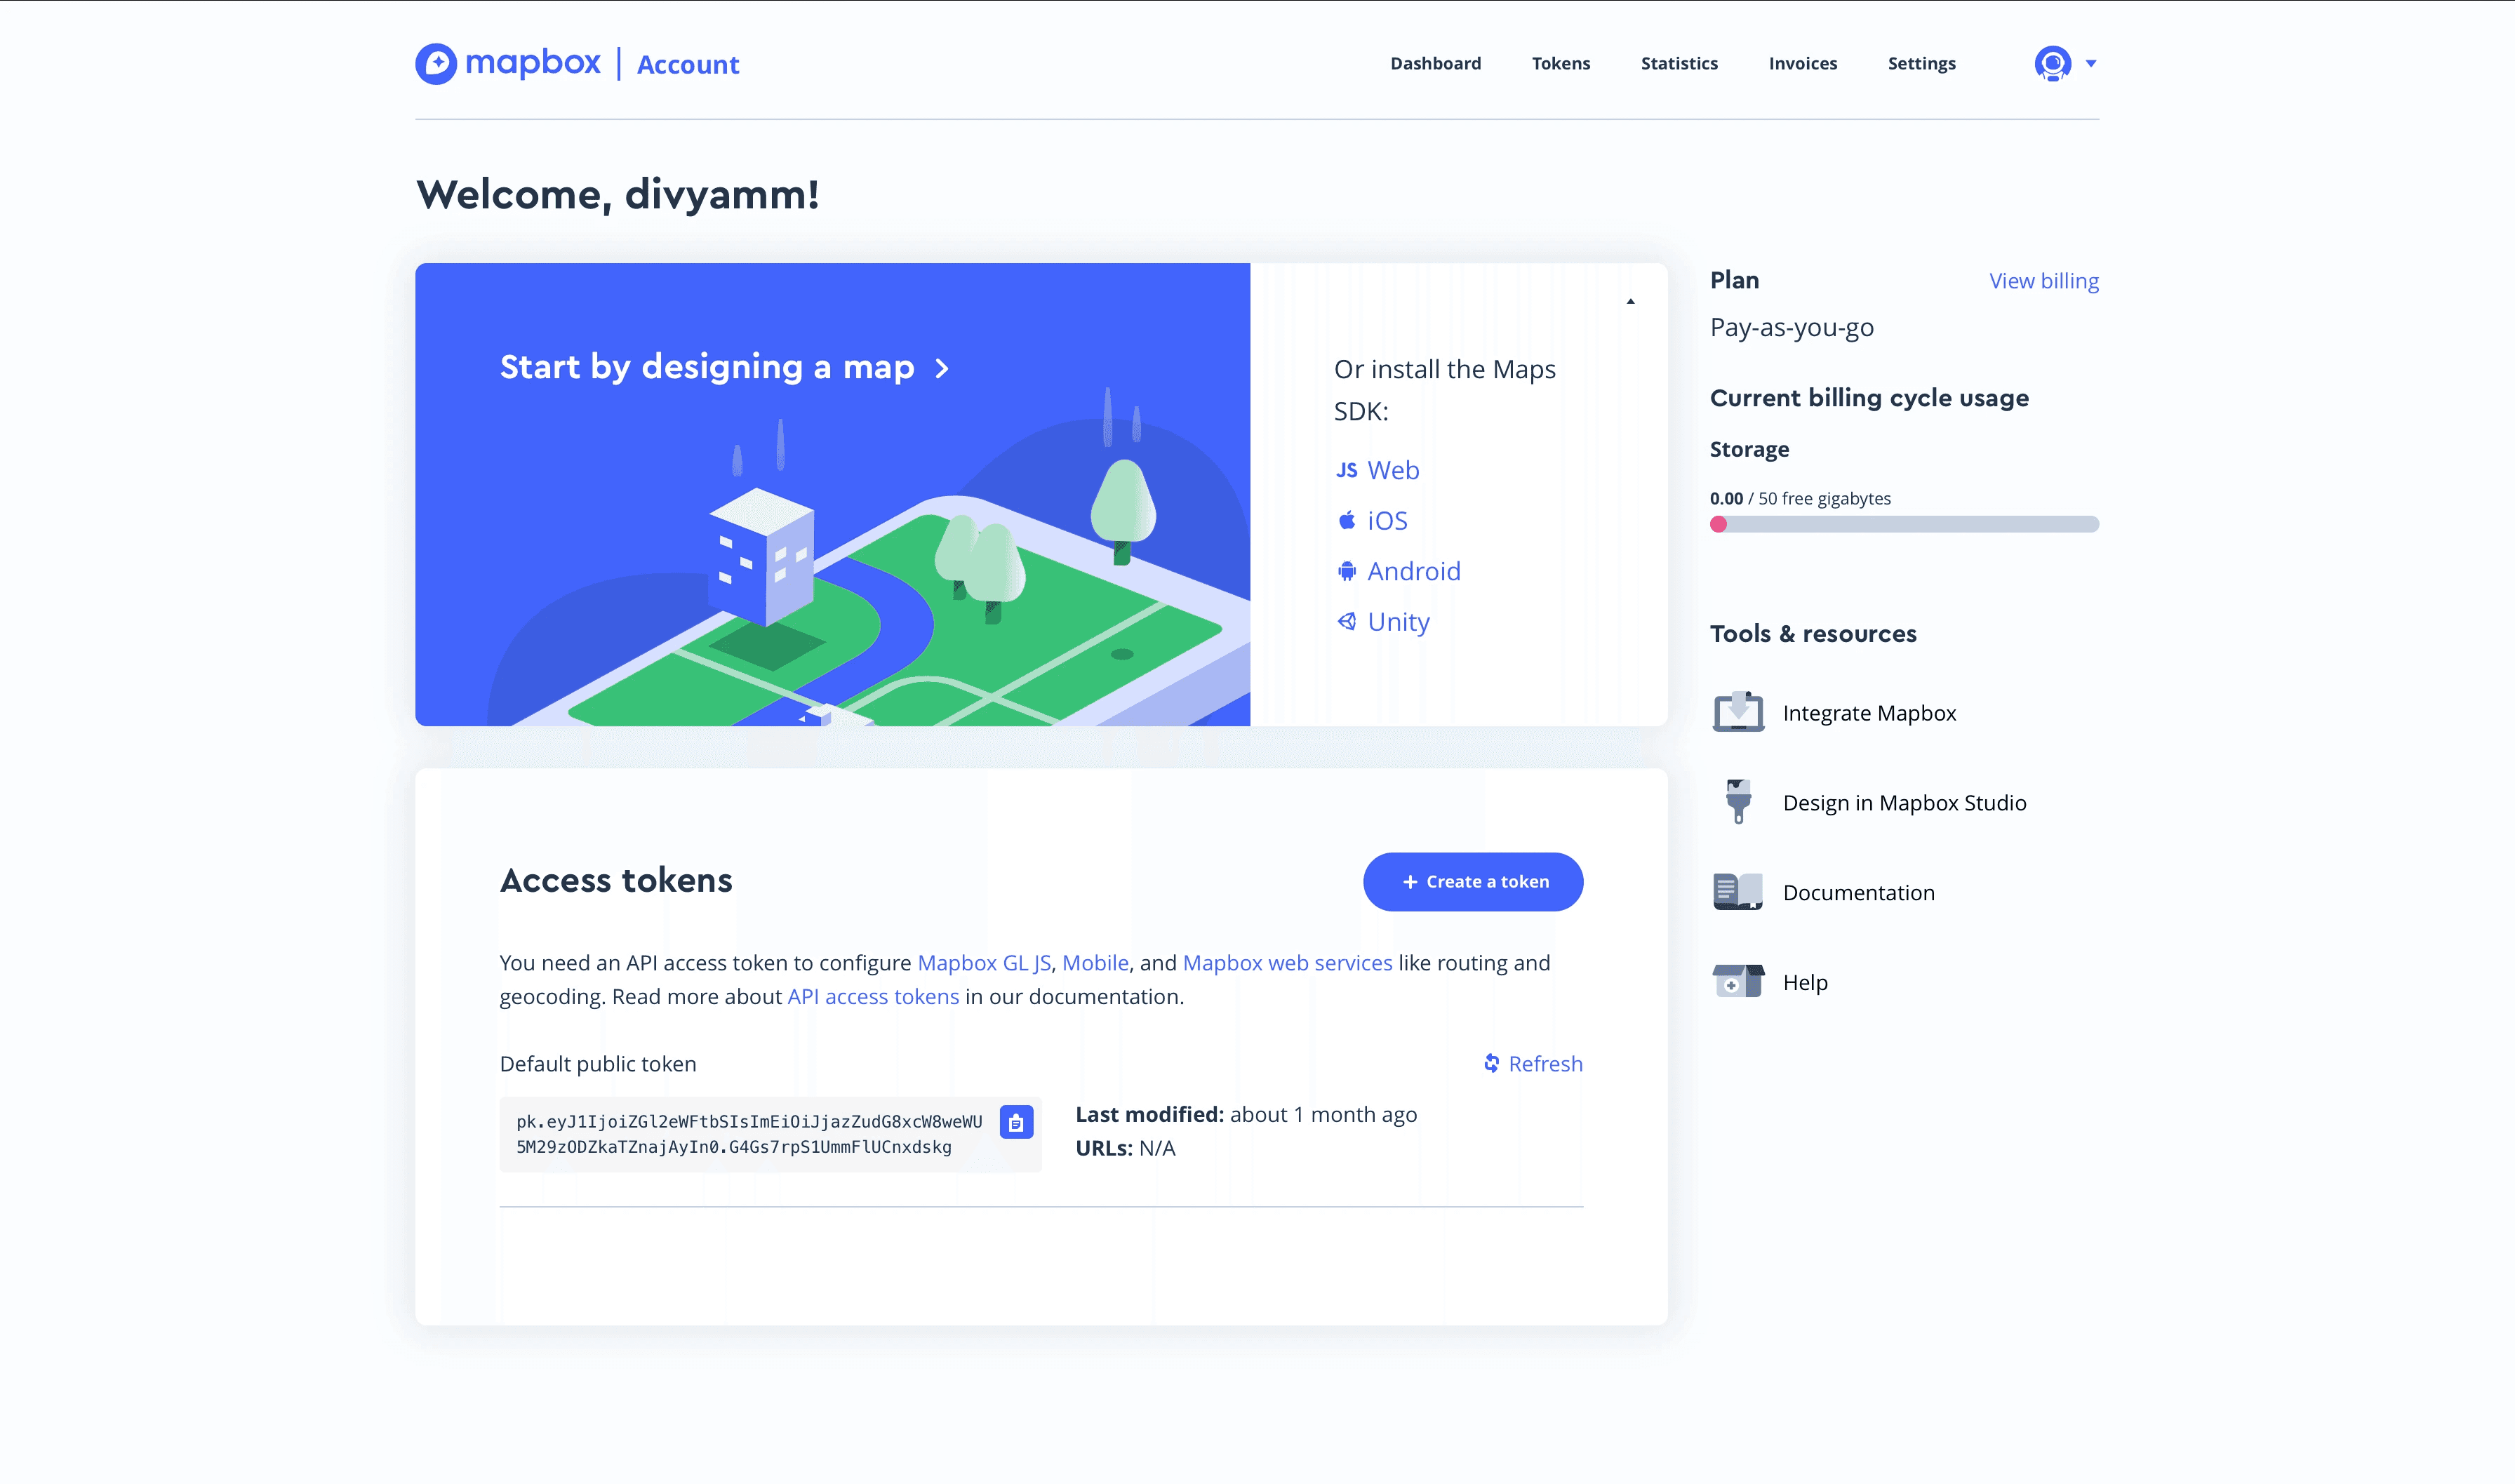
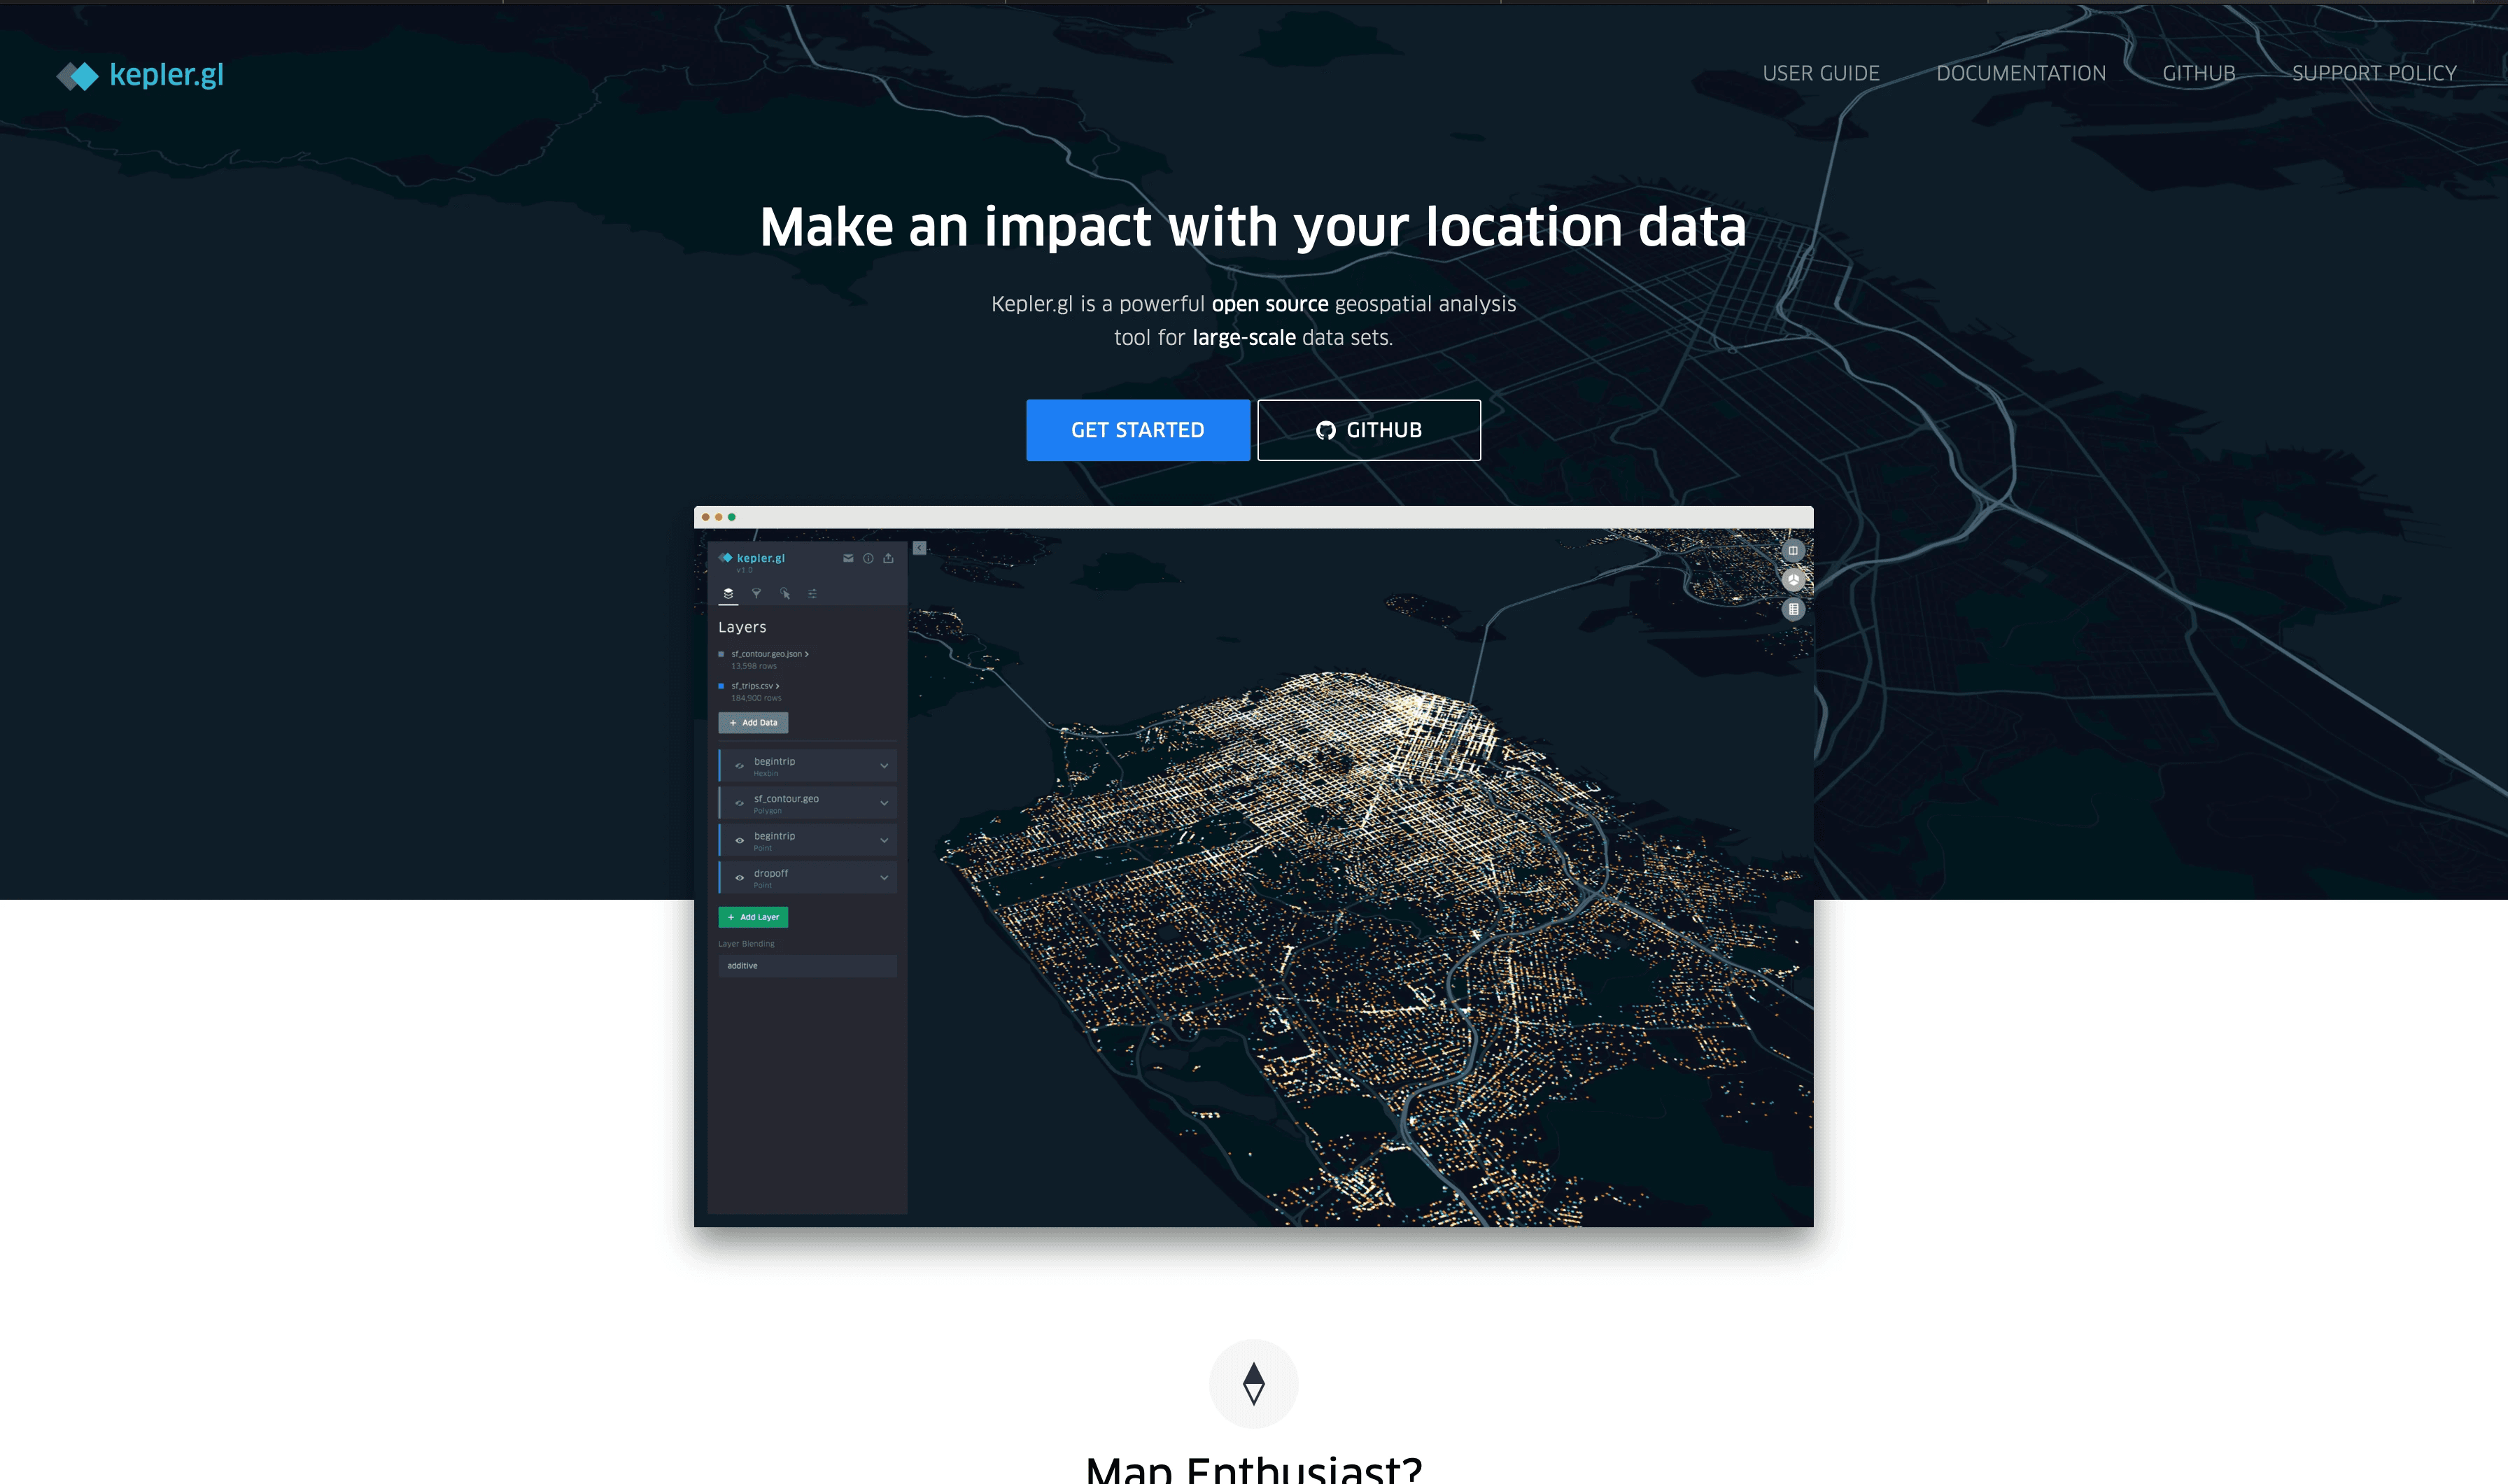
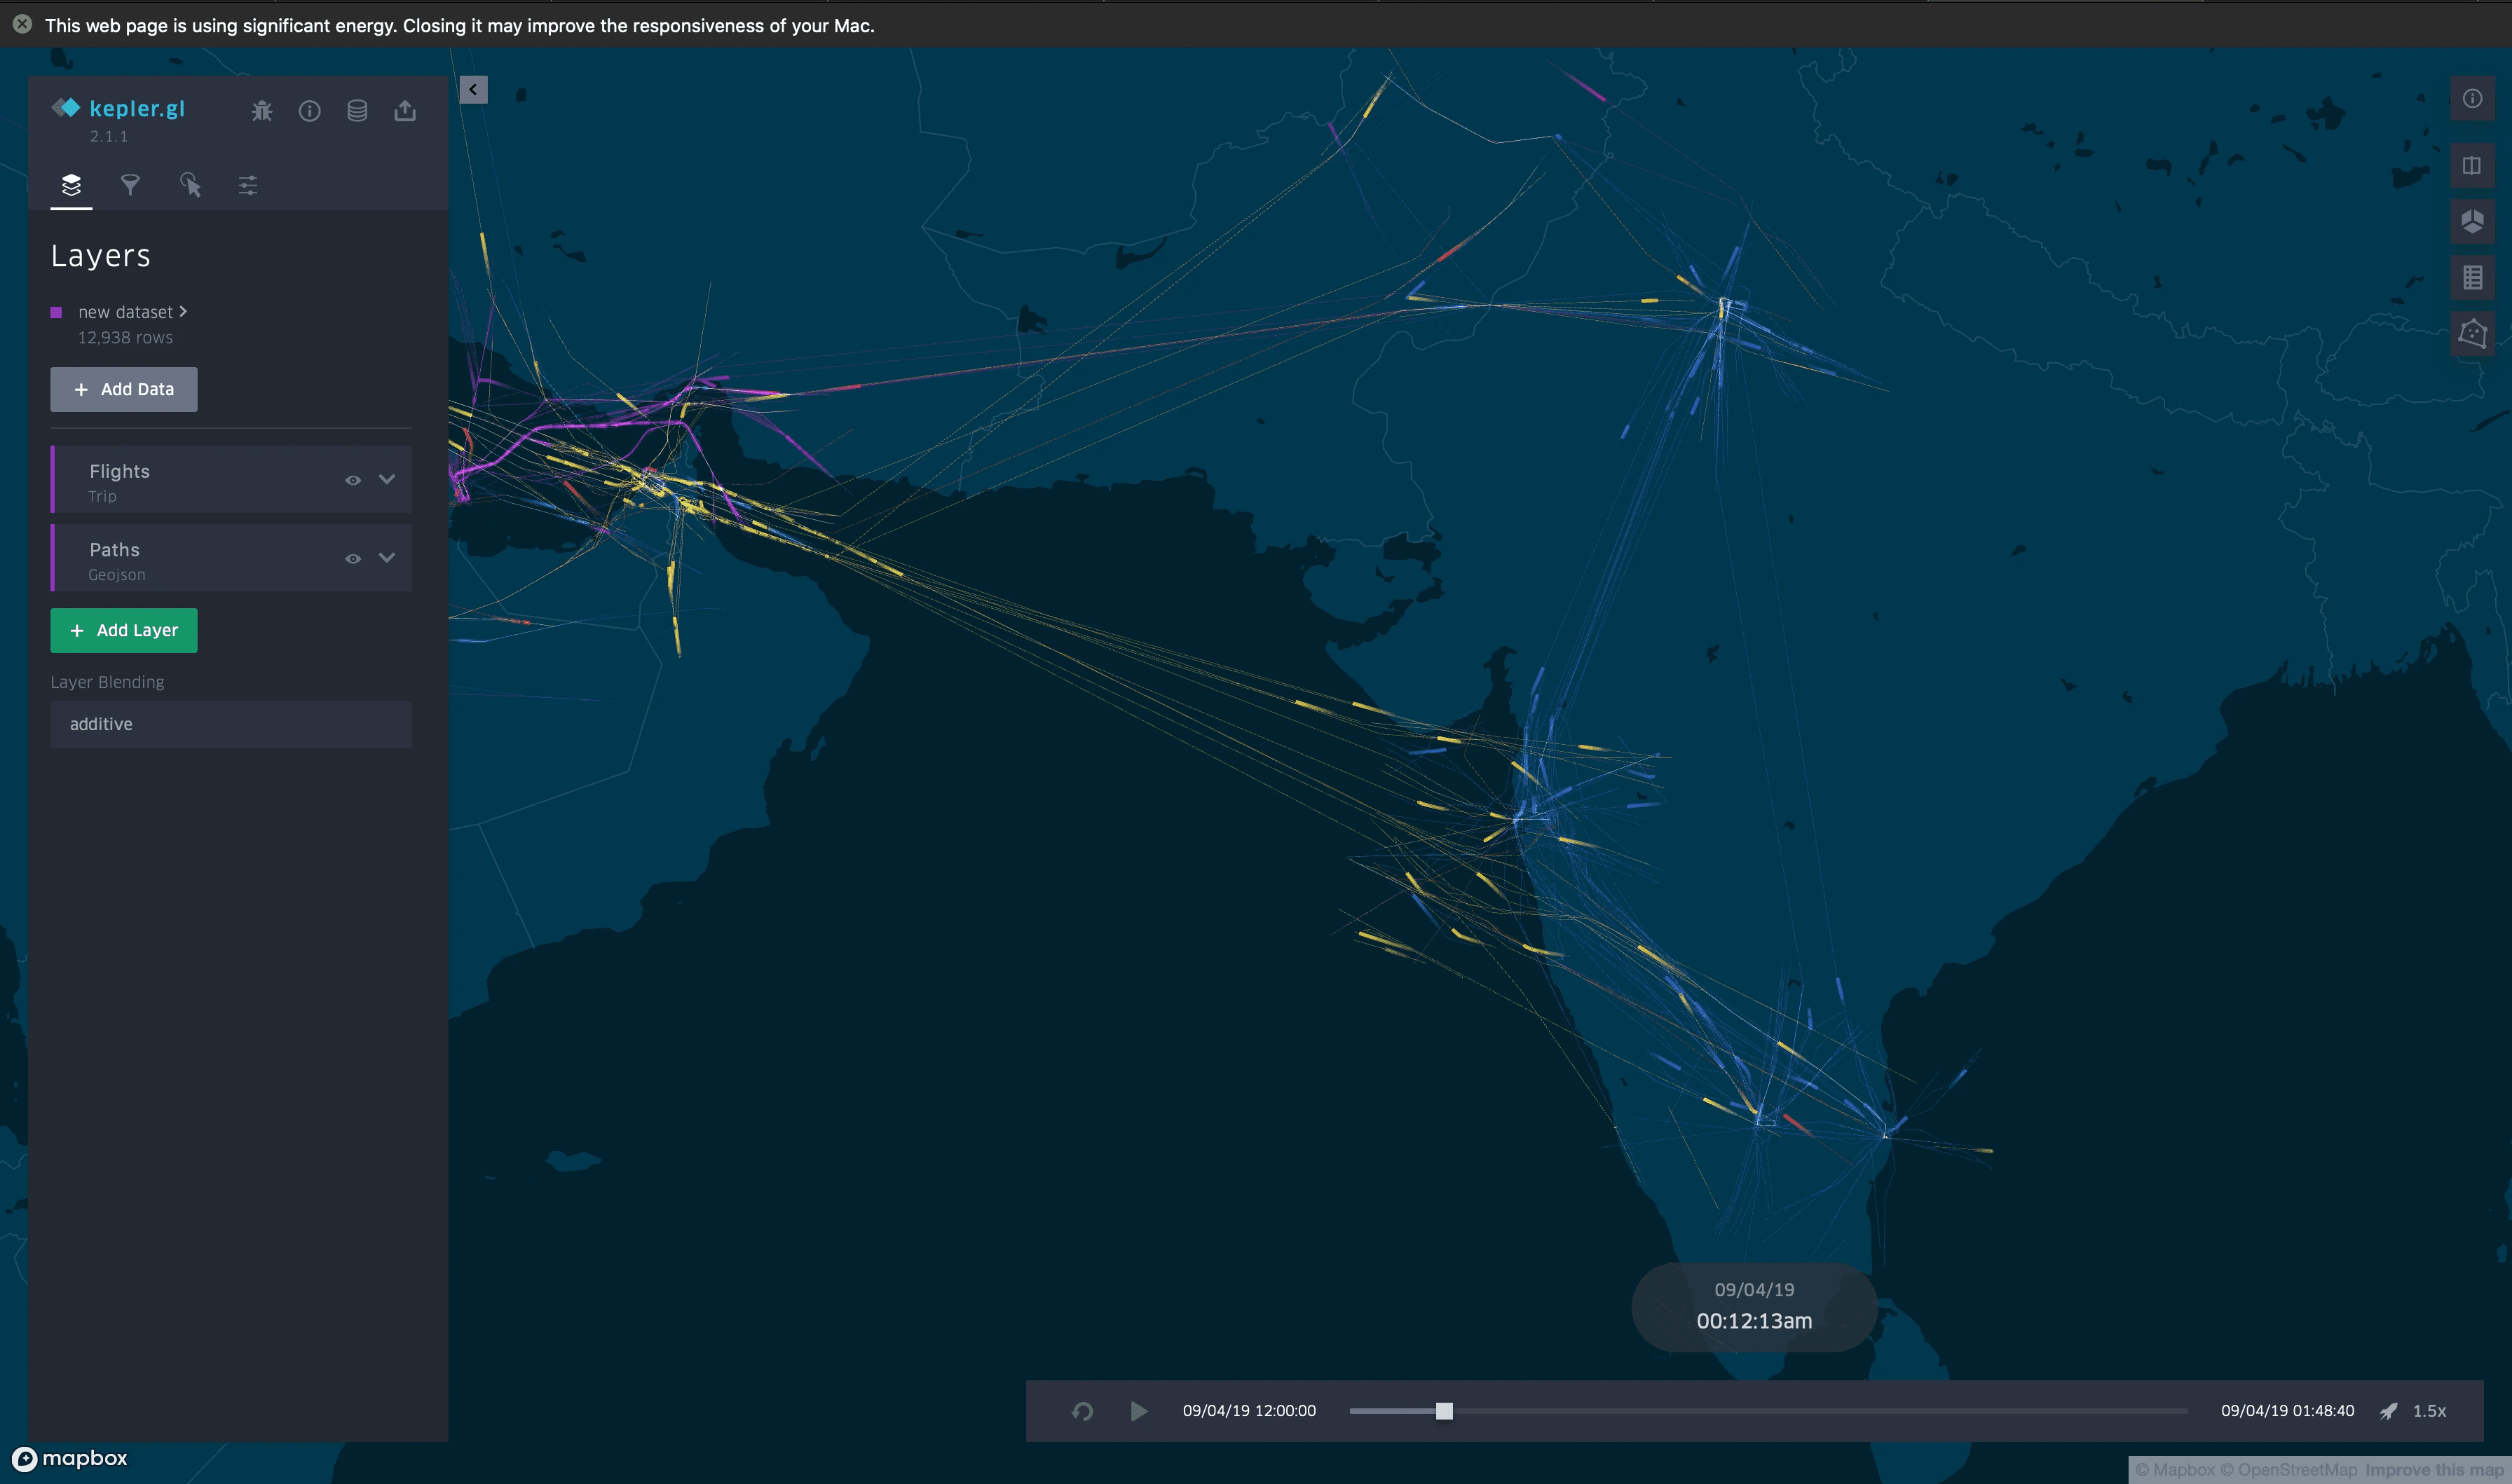
To understand where HERE Studio stood, I benchmarked it against four of its closest competitors, Kepler, Mapbox, ArcGIS, and Carto.
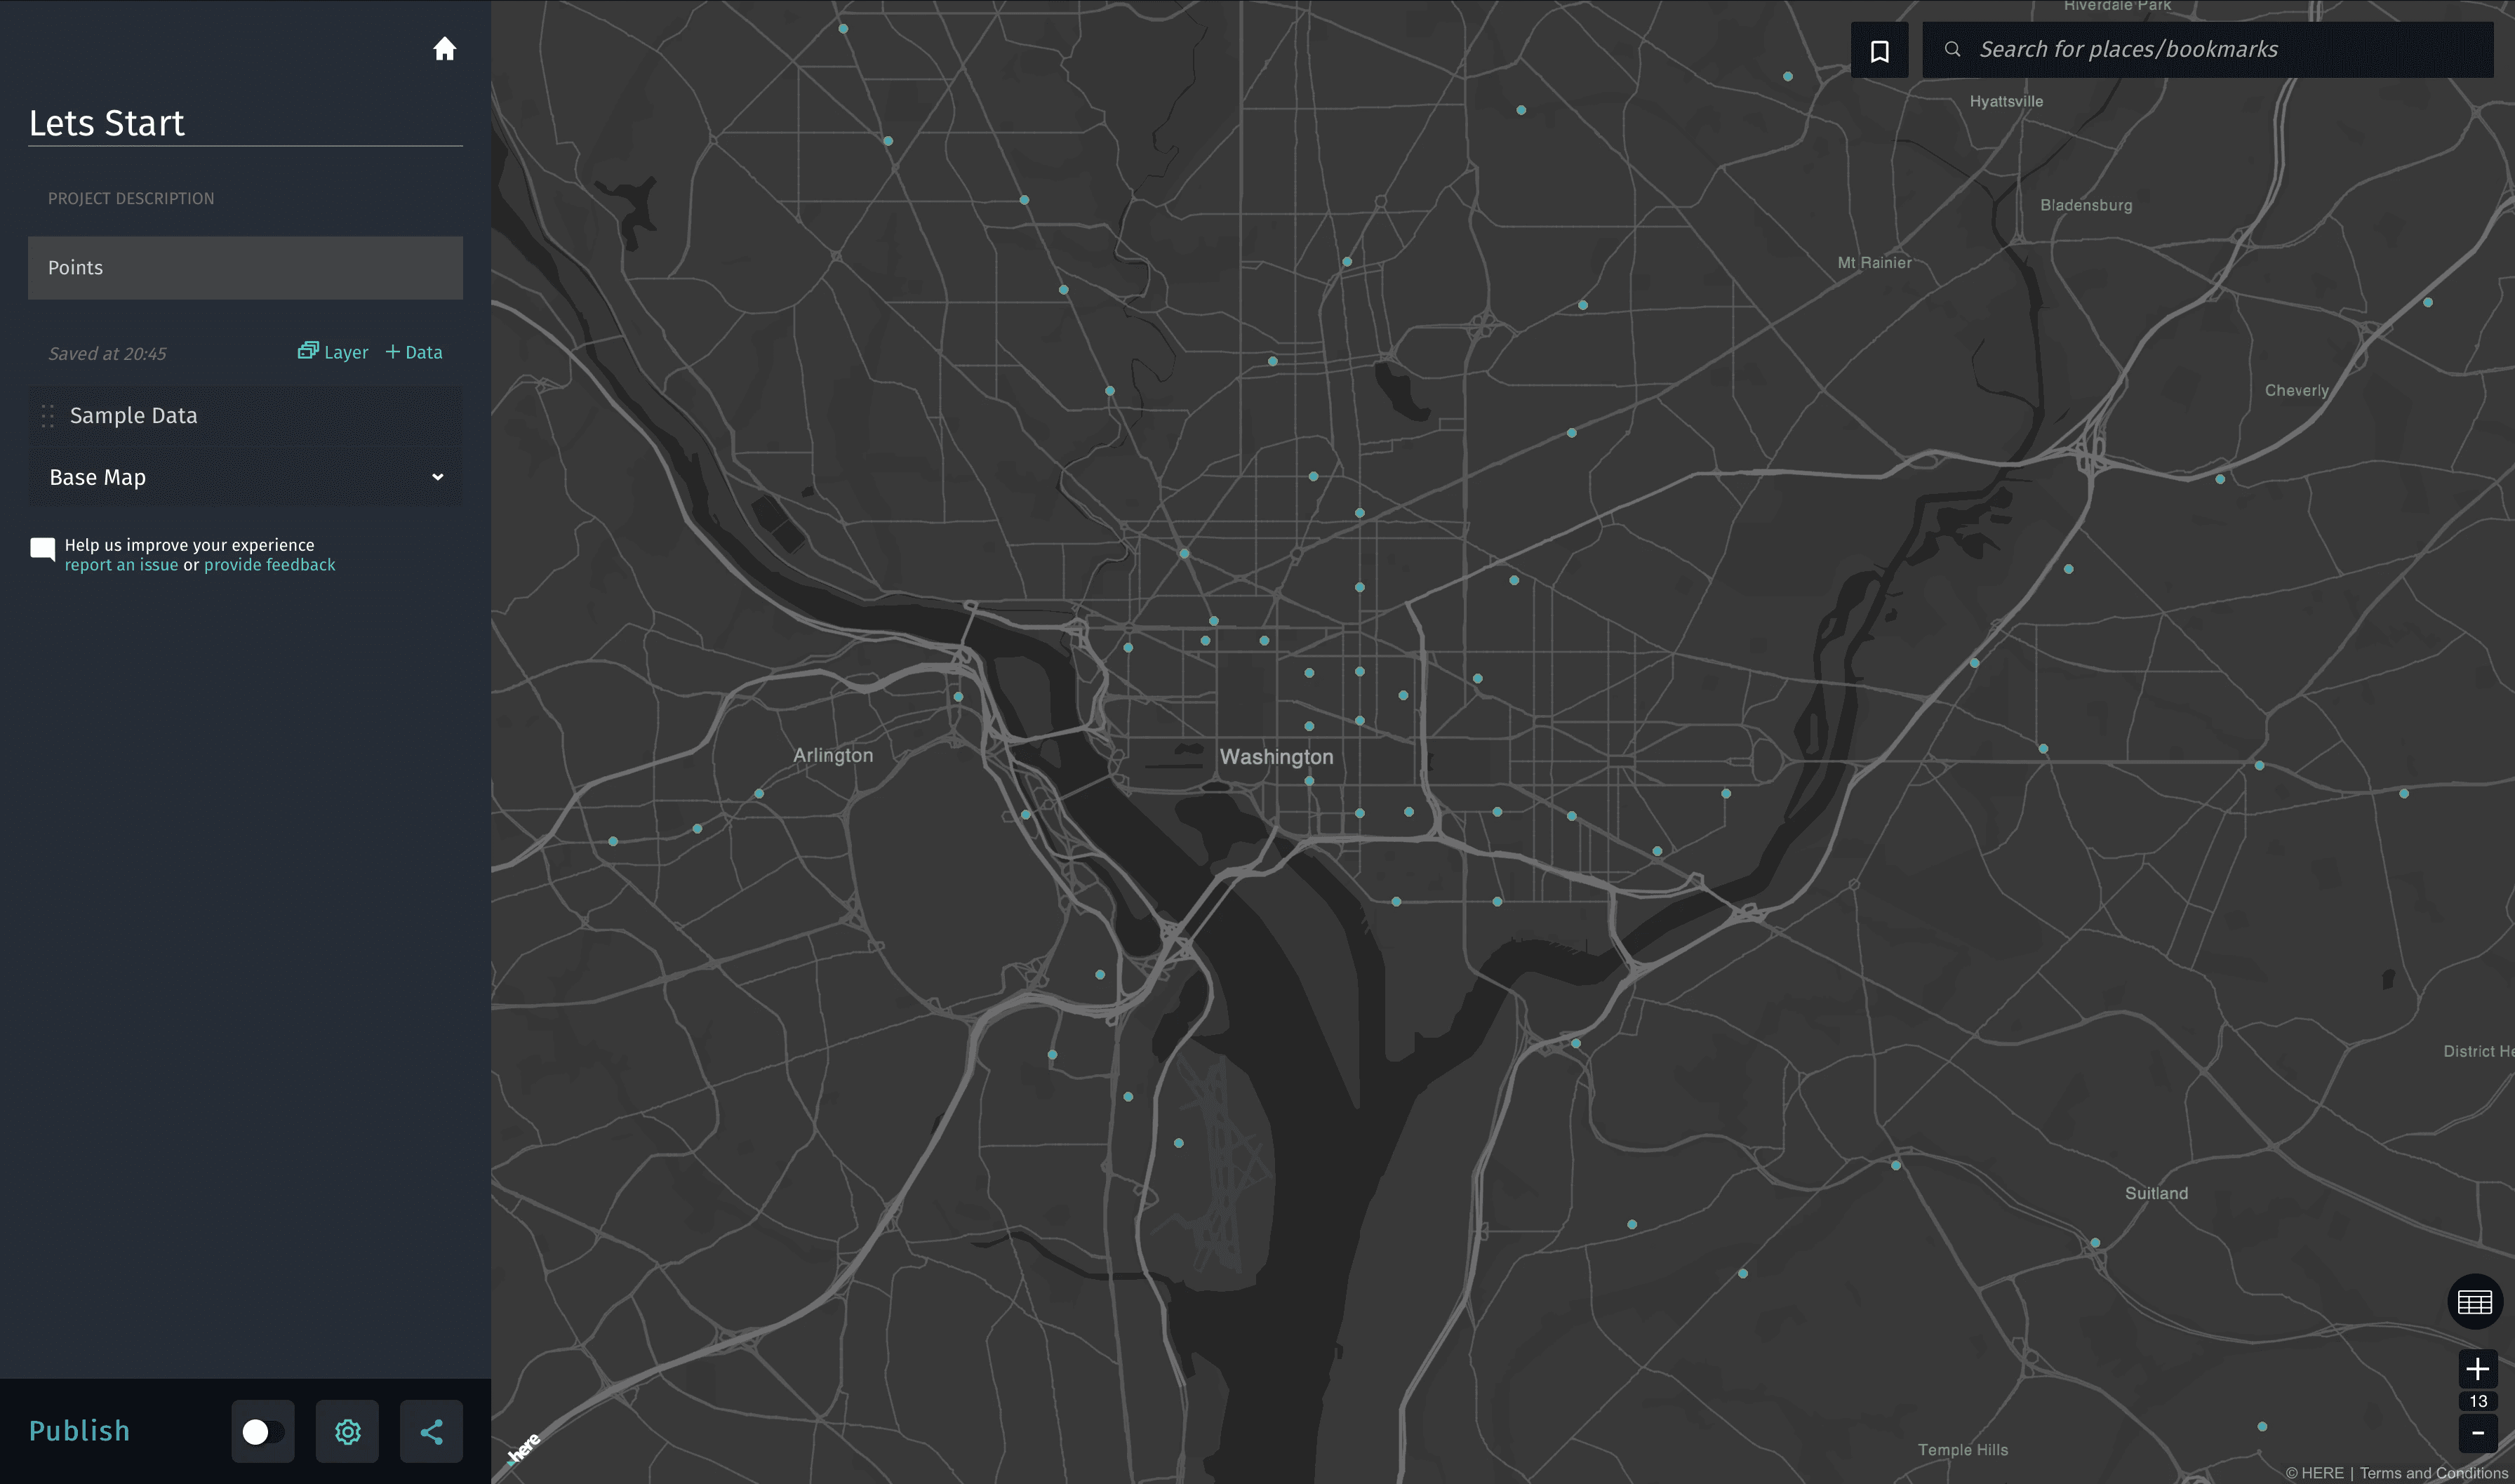
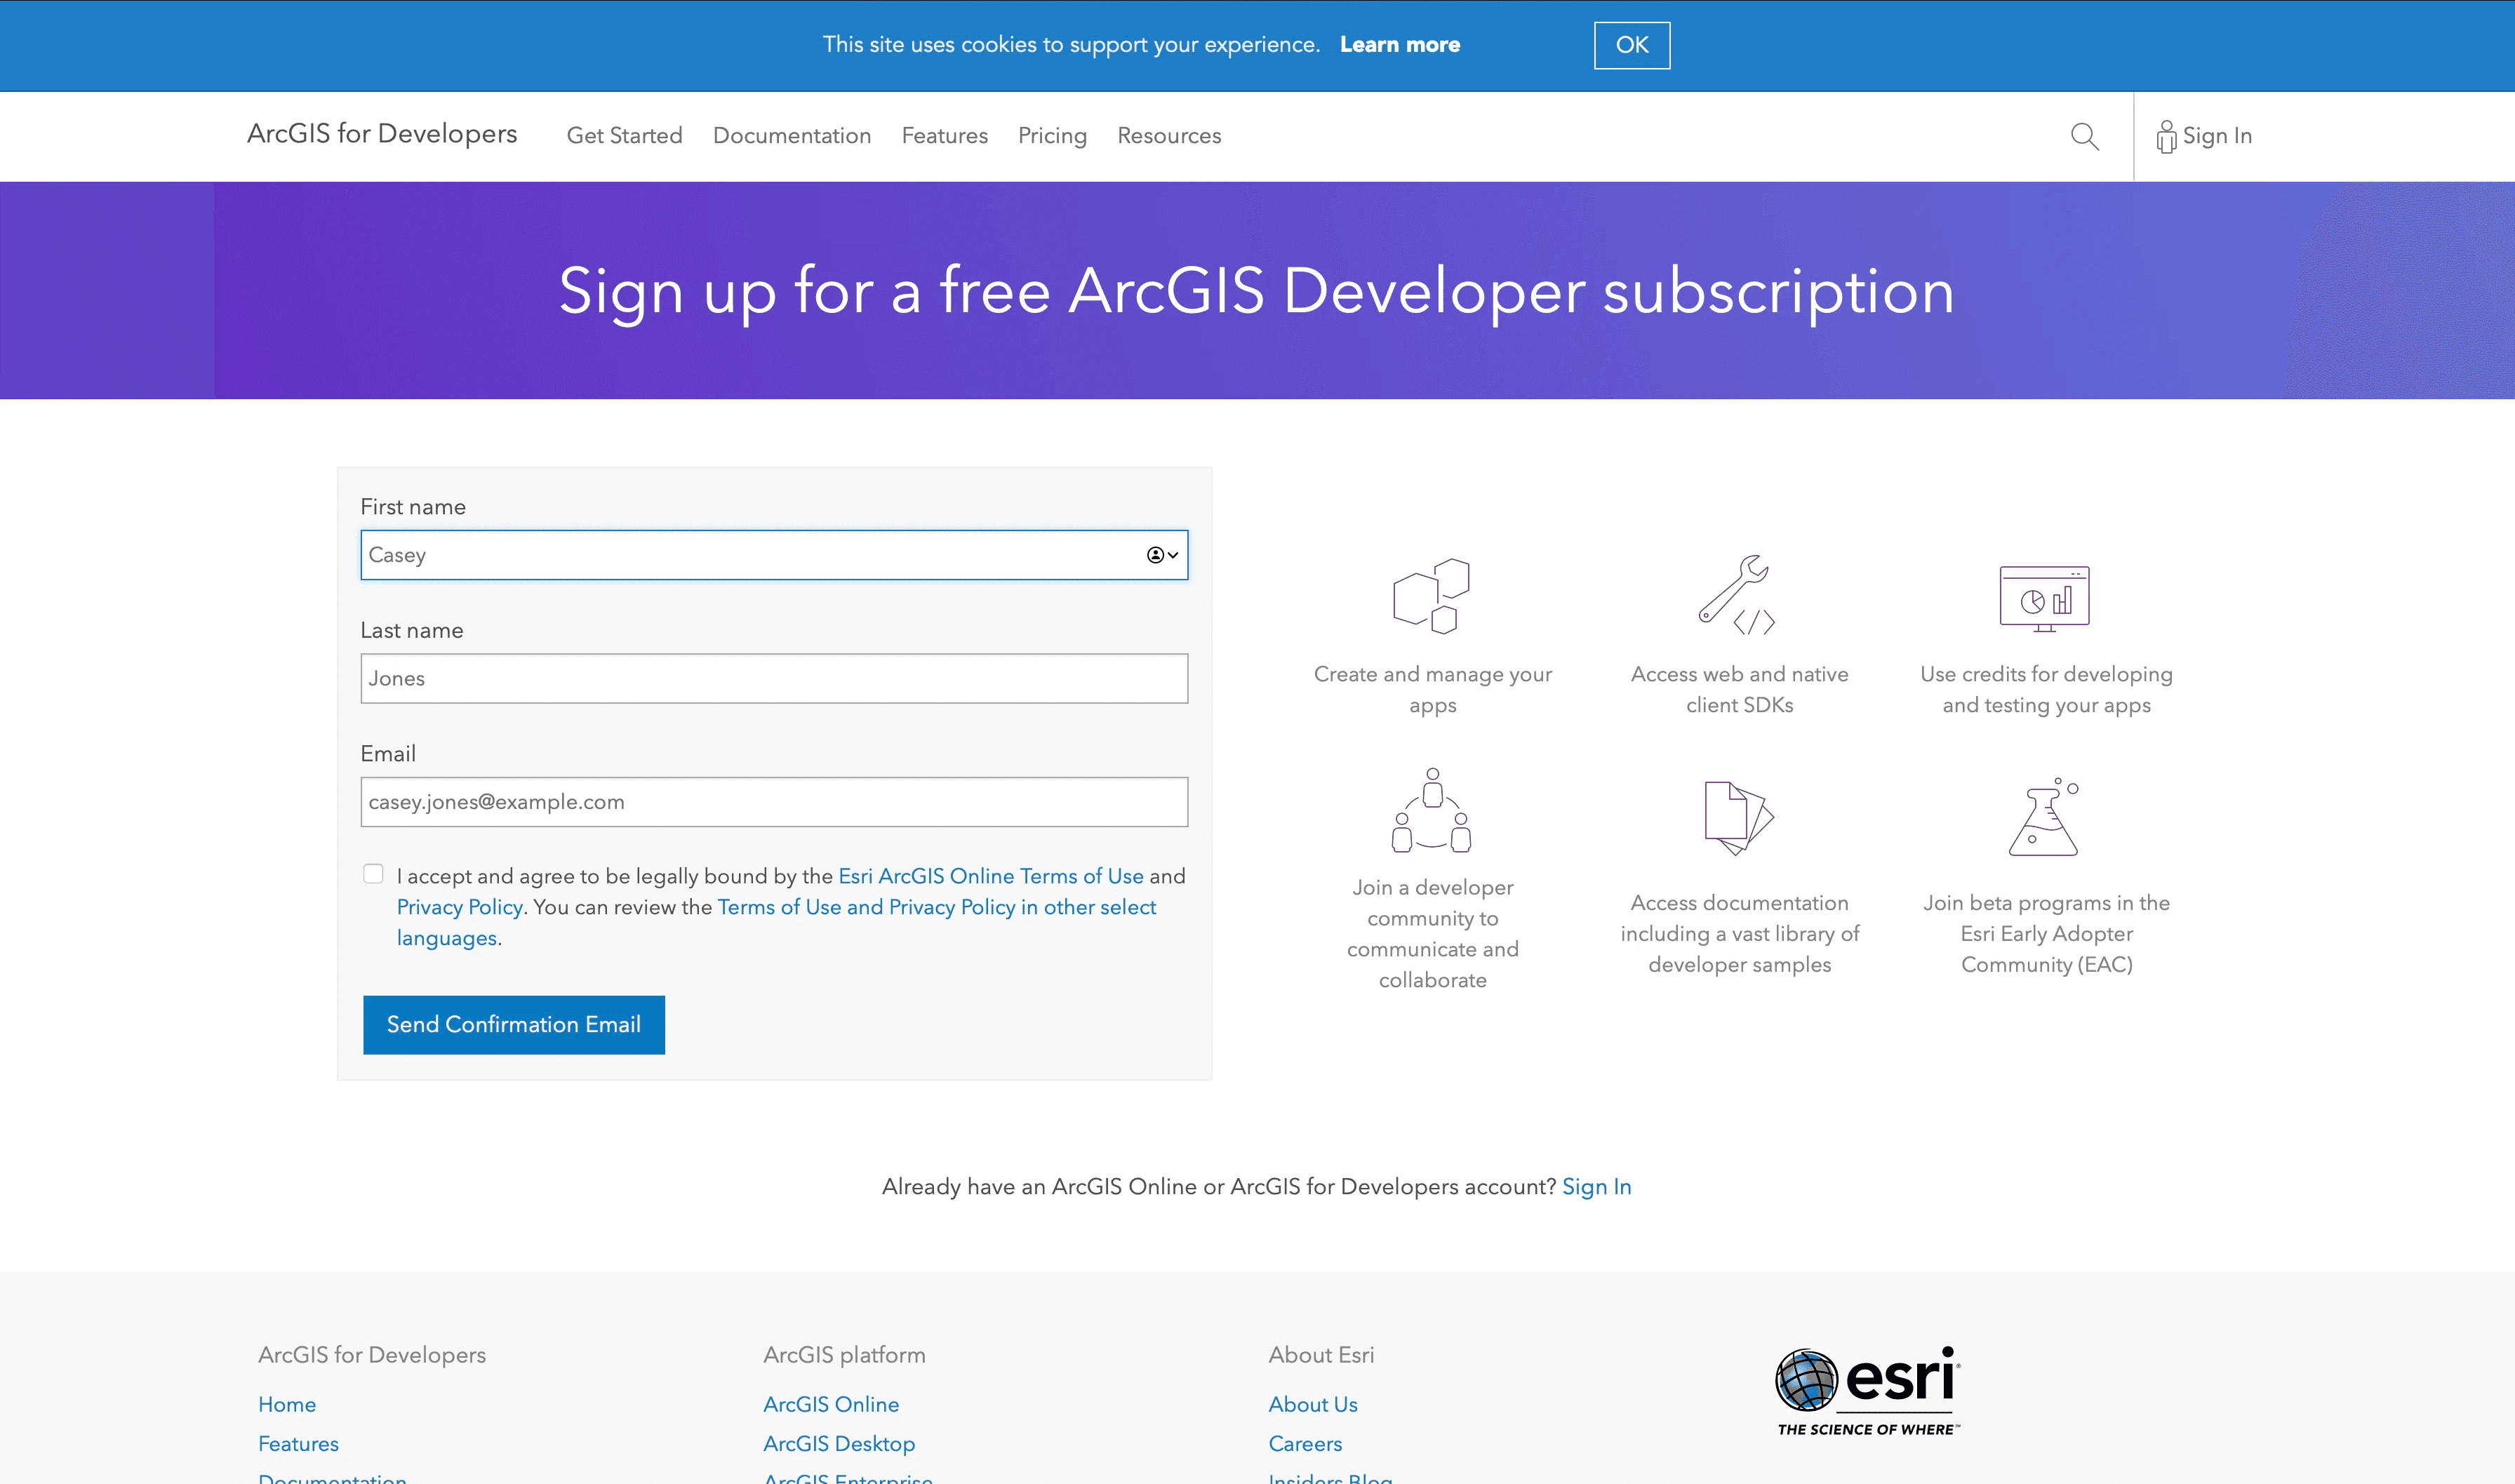
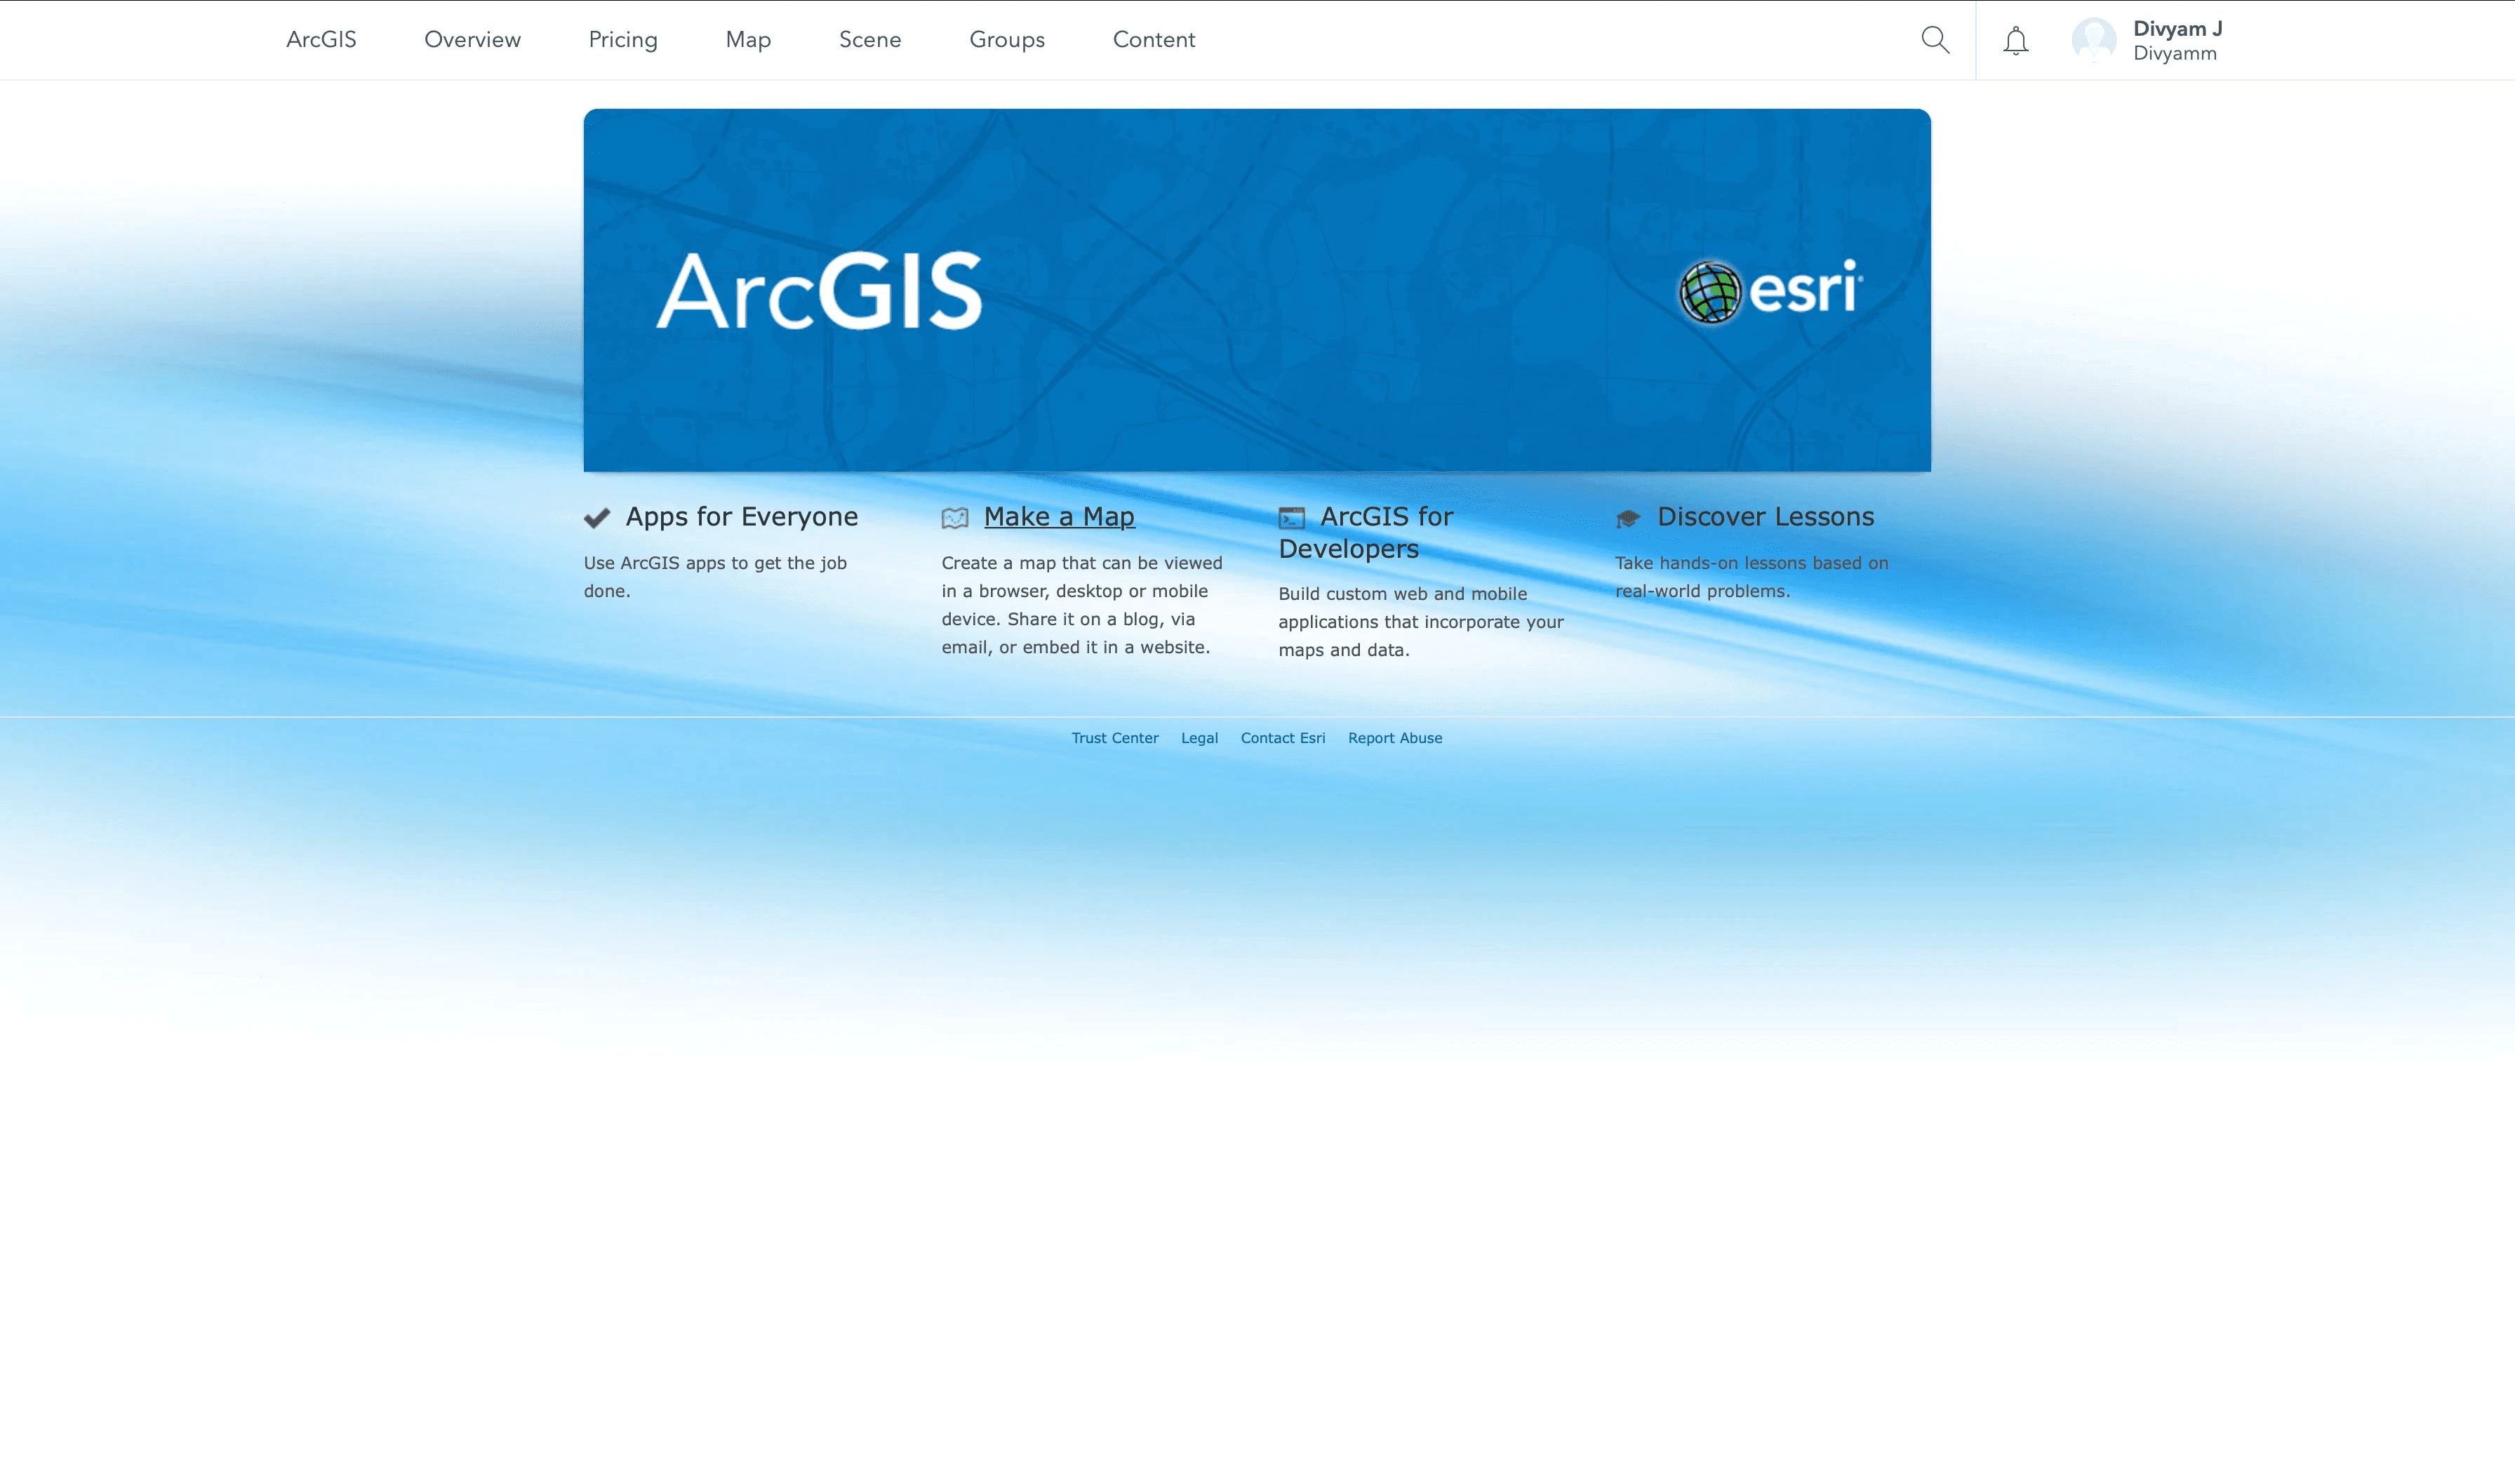
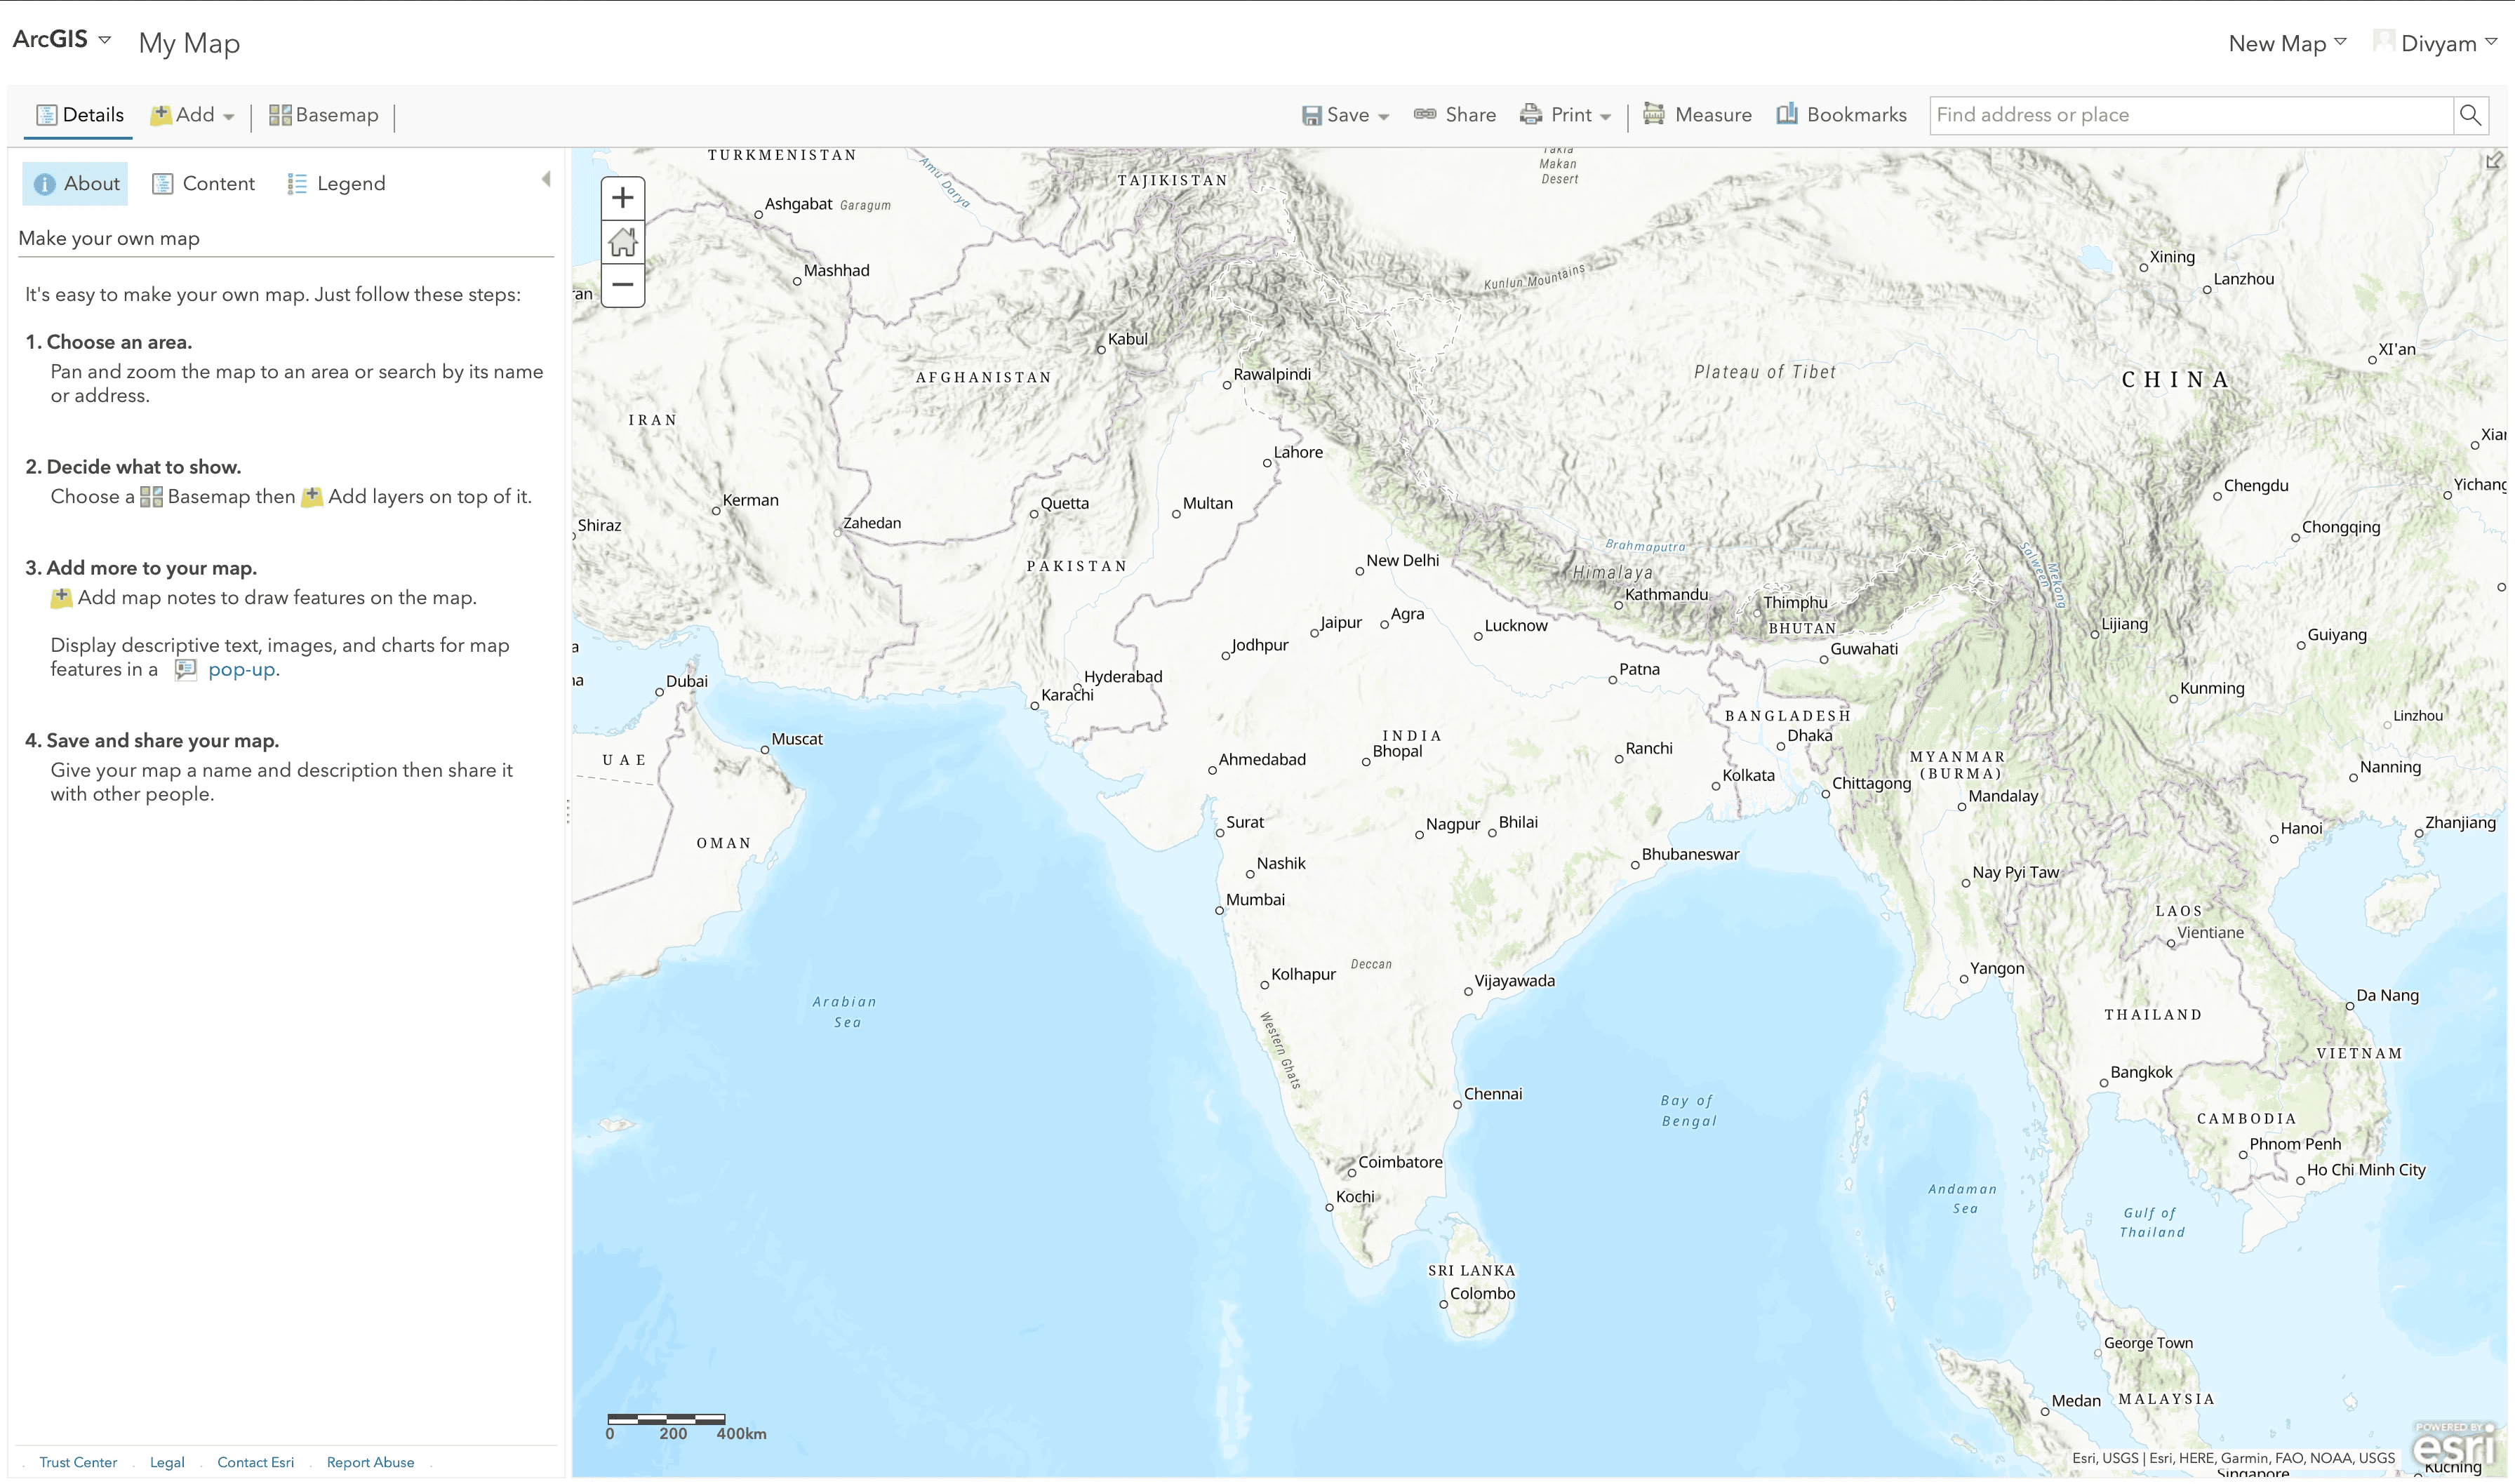
I started with the most basic question: how long does it take to actually start working? I counted the number of clicks each tool needed to reach its map canvas, the main screen, where the real work happens. Those paths are shown below: for each tool, the screens you pass through, arranged in ascending order up to the map canvas, so the difference in how quickly you can get to the heart of each product is visible at a glance.
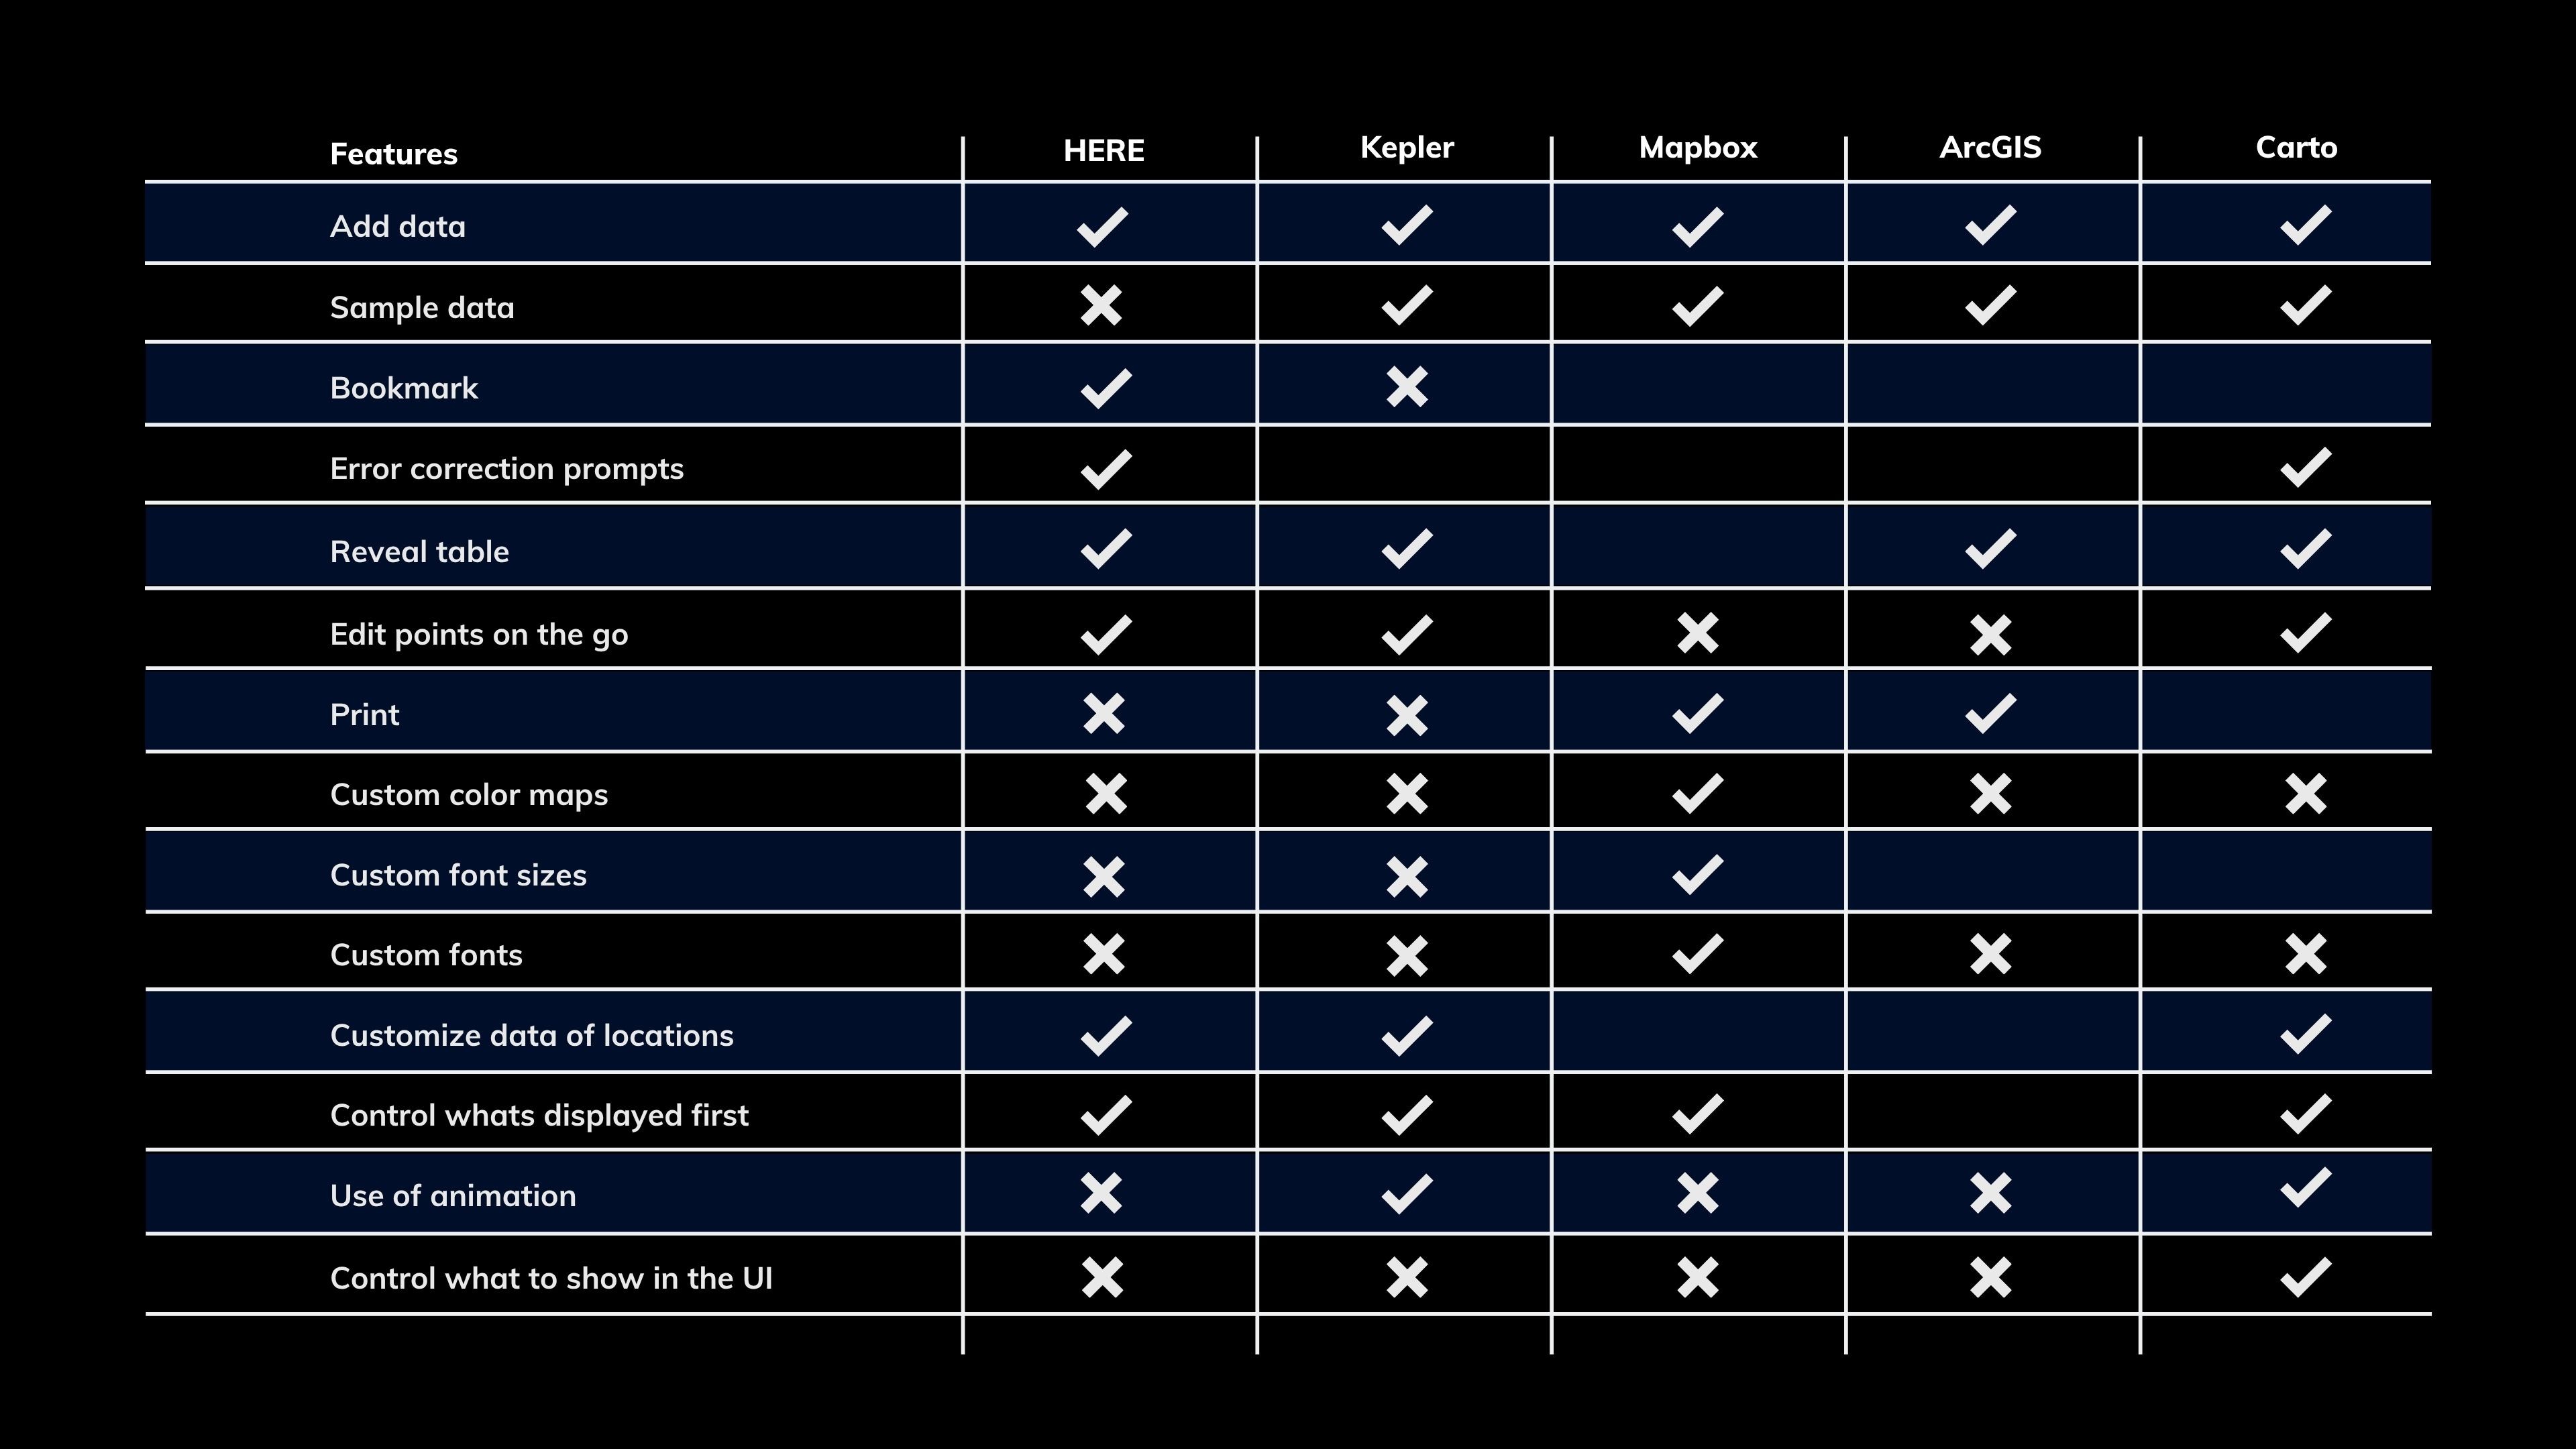
From there I compared the tools along two axes. The first was functional: a feature-by-feature comparison of what each could and couldn't do, spanning data handling, filtering, customization, sharing, and search.
The second was qualitative: how each tool felt to use, scored across things like toolbar alignment, in-context prompts, ease of use, and whether it leaned on a dark or light interface. I went deeper on the areas that mattered most, the home page, sign-up, dashboards, layout, filtering, color, and styling, studying how the strongest competitors handled each.
The comparison made clear where HERE Studio was already competitive and, more usefully, where it fell behind, especially around (getting started / onboarding / the specific area which was found weakest), which is exactly where I concentrated the redesign.
Functional Analysis


Qualitative Analysis

Home Page

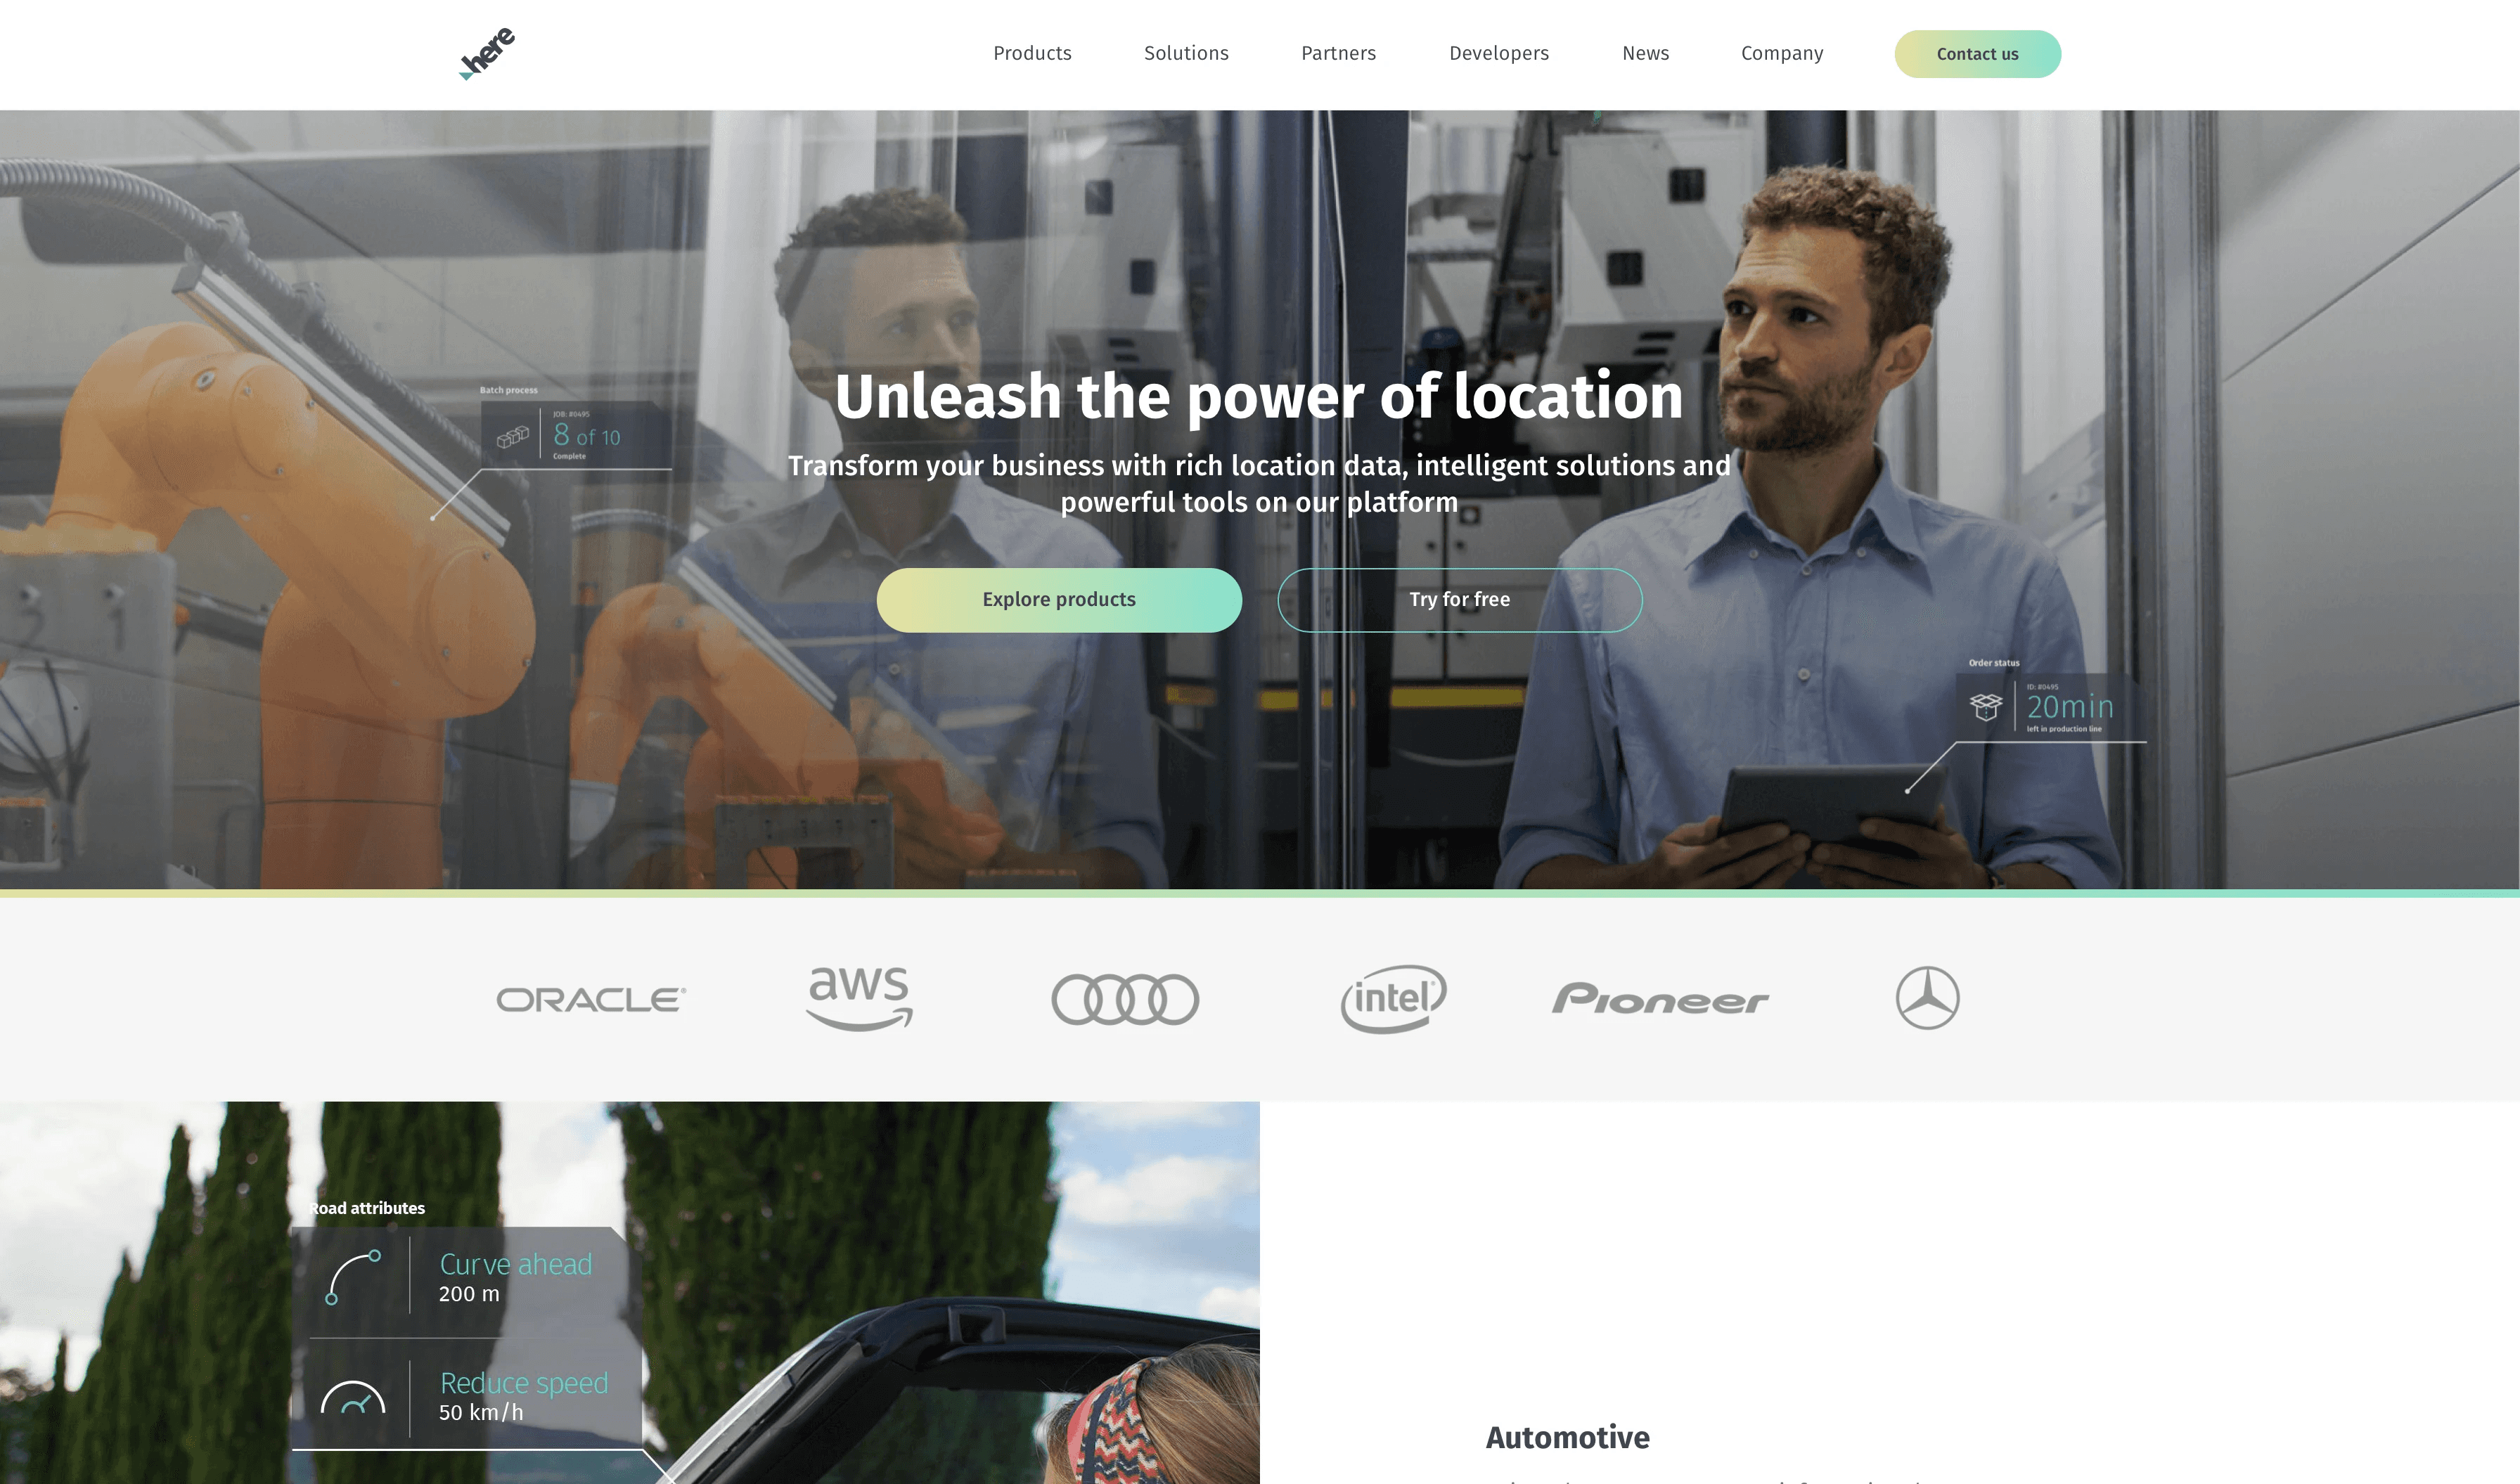
These are the first pages which the user sees after entering the URL. Importance level is very high as this page sets the scene, it is recommended that business firms use their iconic colors, fonts and logos to maximum extent to make them stand apart and make an unforgettable impression on the user.
Sign Up Page

1
HERE
4
Carto
2
Mapbox
3
ArcGiS
Movement from dark to light theme is straining for the eyes.
Function like sorting in table is not evident.
Table appears to be long & densely packed with data.
3rd party sign up is available. Provides useful info. Good balance of branding & functionality. Requires 3 inputs.
No 3rd party sign up option.
Very minimalistic setup.
But just simplicity is not enough.
Requires 6 inputs.
No 3rd party sign up option.
Provides useful info with infographics
Needs to work on aesthetics.
Requires 3 inputs.
Account Dashboard

1
HERE
4
Carto
2
Mapbox
This is more of a print form approach than a digital web form.
Movement from dark to light theme is straining for the eyes.
Function like sorting in table is not evident.
Table appears to be long & densely packed with data.
Good setup and layout. Use of different colors to indicate level of storage used. Sufficient amount of info is provided.
Good use of hover response.
Detailed info is not provided.
The big start button is
overshadowing other elements.
Dashboard

1
HERE
4
Carto
2
Mapbox
Macro space is less.Footer is missing.Time of edit is not useful data.Visual weight of letters is insufficient.
Import data from partner service directly.Centre aligned.Using 3 colour rule. (blue, white, black)Footer is present.
Thumbnail is too small.Footer is missing.Good use of hover response.Does not highlight the page you're on.
Map Canvas Layout

1
HERE
4
Carto
2
Mapbox
Uses card layout. Few features are not evident. Minimum number of elements used. Neat & balanced UI = less strain.
Uniquely uses both sides of the screen when required. Uses card layout. Regularly uses hover to show prompts.
Has most number of elements, densely but neatly packed, uses breadcrumbs so that user is not overwhelmed looking at elements.
1
ArcGiS
5
Kepler
Functions are classified in categories.
Dropdowns are used extensively.
Hover is used to illuminate few functions.
UI is not very engaging.
Very well laid setup.
2-3 non-priority functions illuminate when hovered upon.
Prompts are used extensively.
Layout Analysis

2
Home
1
Search
3
Zoom In-Out
Filter

4
Carto
1
Kepler
All the options are displayed one after the other, the numerical variables use slider and strings simply select & deselect.
Type of variable is automatically detected & accordingly the slider is activated or subcategory is opened. If its a float or integer then slider, if its a string then subcategory.
Filter

1
HERE
2
Mapbox
The system doesn't detect the type of variable. User gets to choose the feature from a dropdown but the value to be compared with is to be typed & accepts all value which it should not.
User has the option to not only filter by features from the uploaded dataset but also components.
Color

4
Carto
2
Mapbox
User can use auto style which allots color with respect to featuresor can customise accordingly. The interface is user-friendly.
User can use auto style which allots color with respect to featuresor can customise accordingly. The interface is user-friendly.
Color In Kepler

1
Kepler
Kepler does everything what Carto does but in a cleaner way. According to Hick's law, number of options to select at a time is proportional to load on user.
Color

1
HERE
2
ArcGiS
User has the option to use auto style, but there are no color palettes. There is an option to add attribution.
Everything else dims down to highlight the color box when its selected. Steps are mentioned.Number of color palettes to choose from.Attribution is followed by a dropdown of options.
Color
1
HERE
2
Kepler
3
Carto
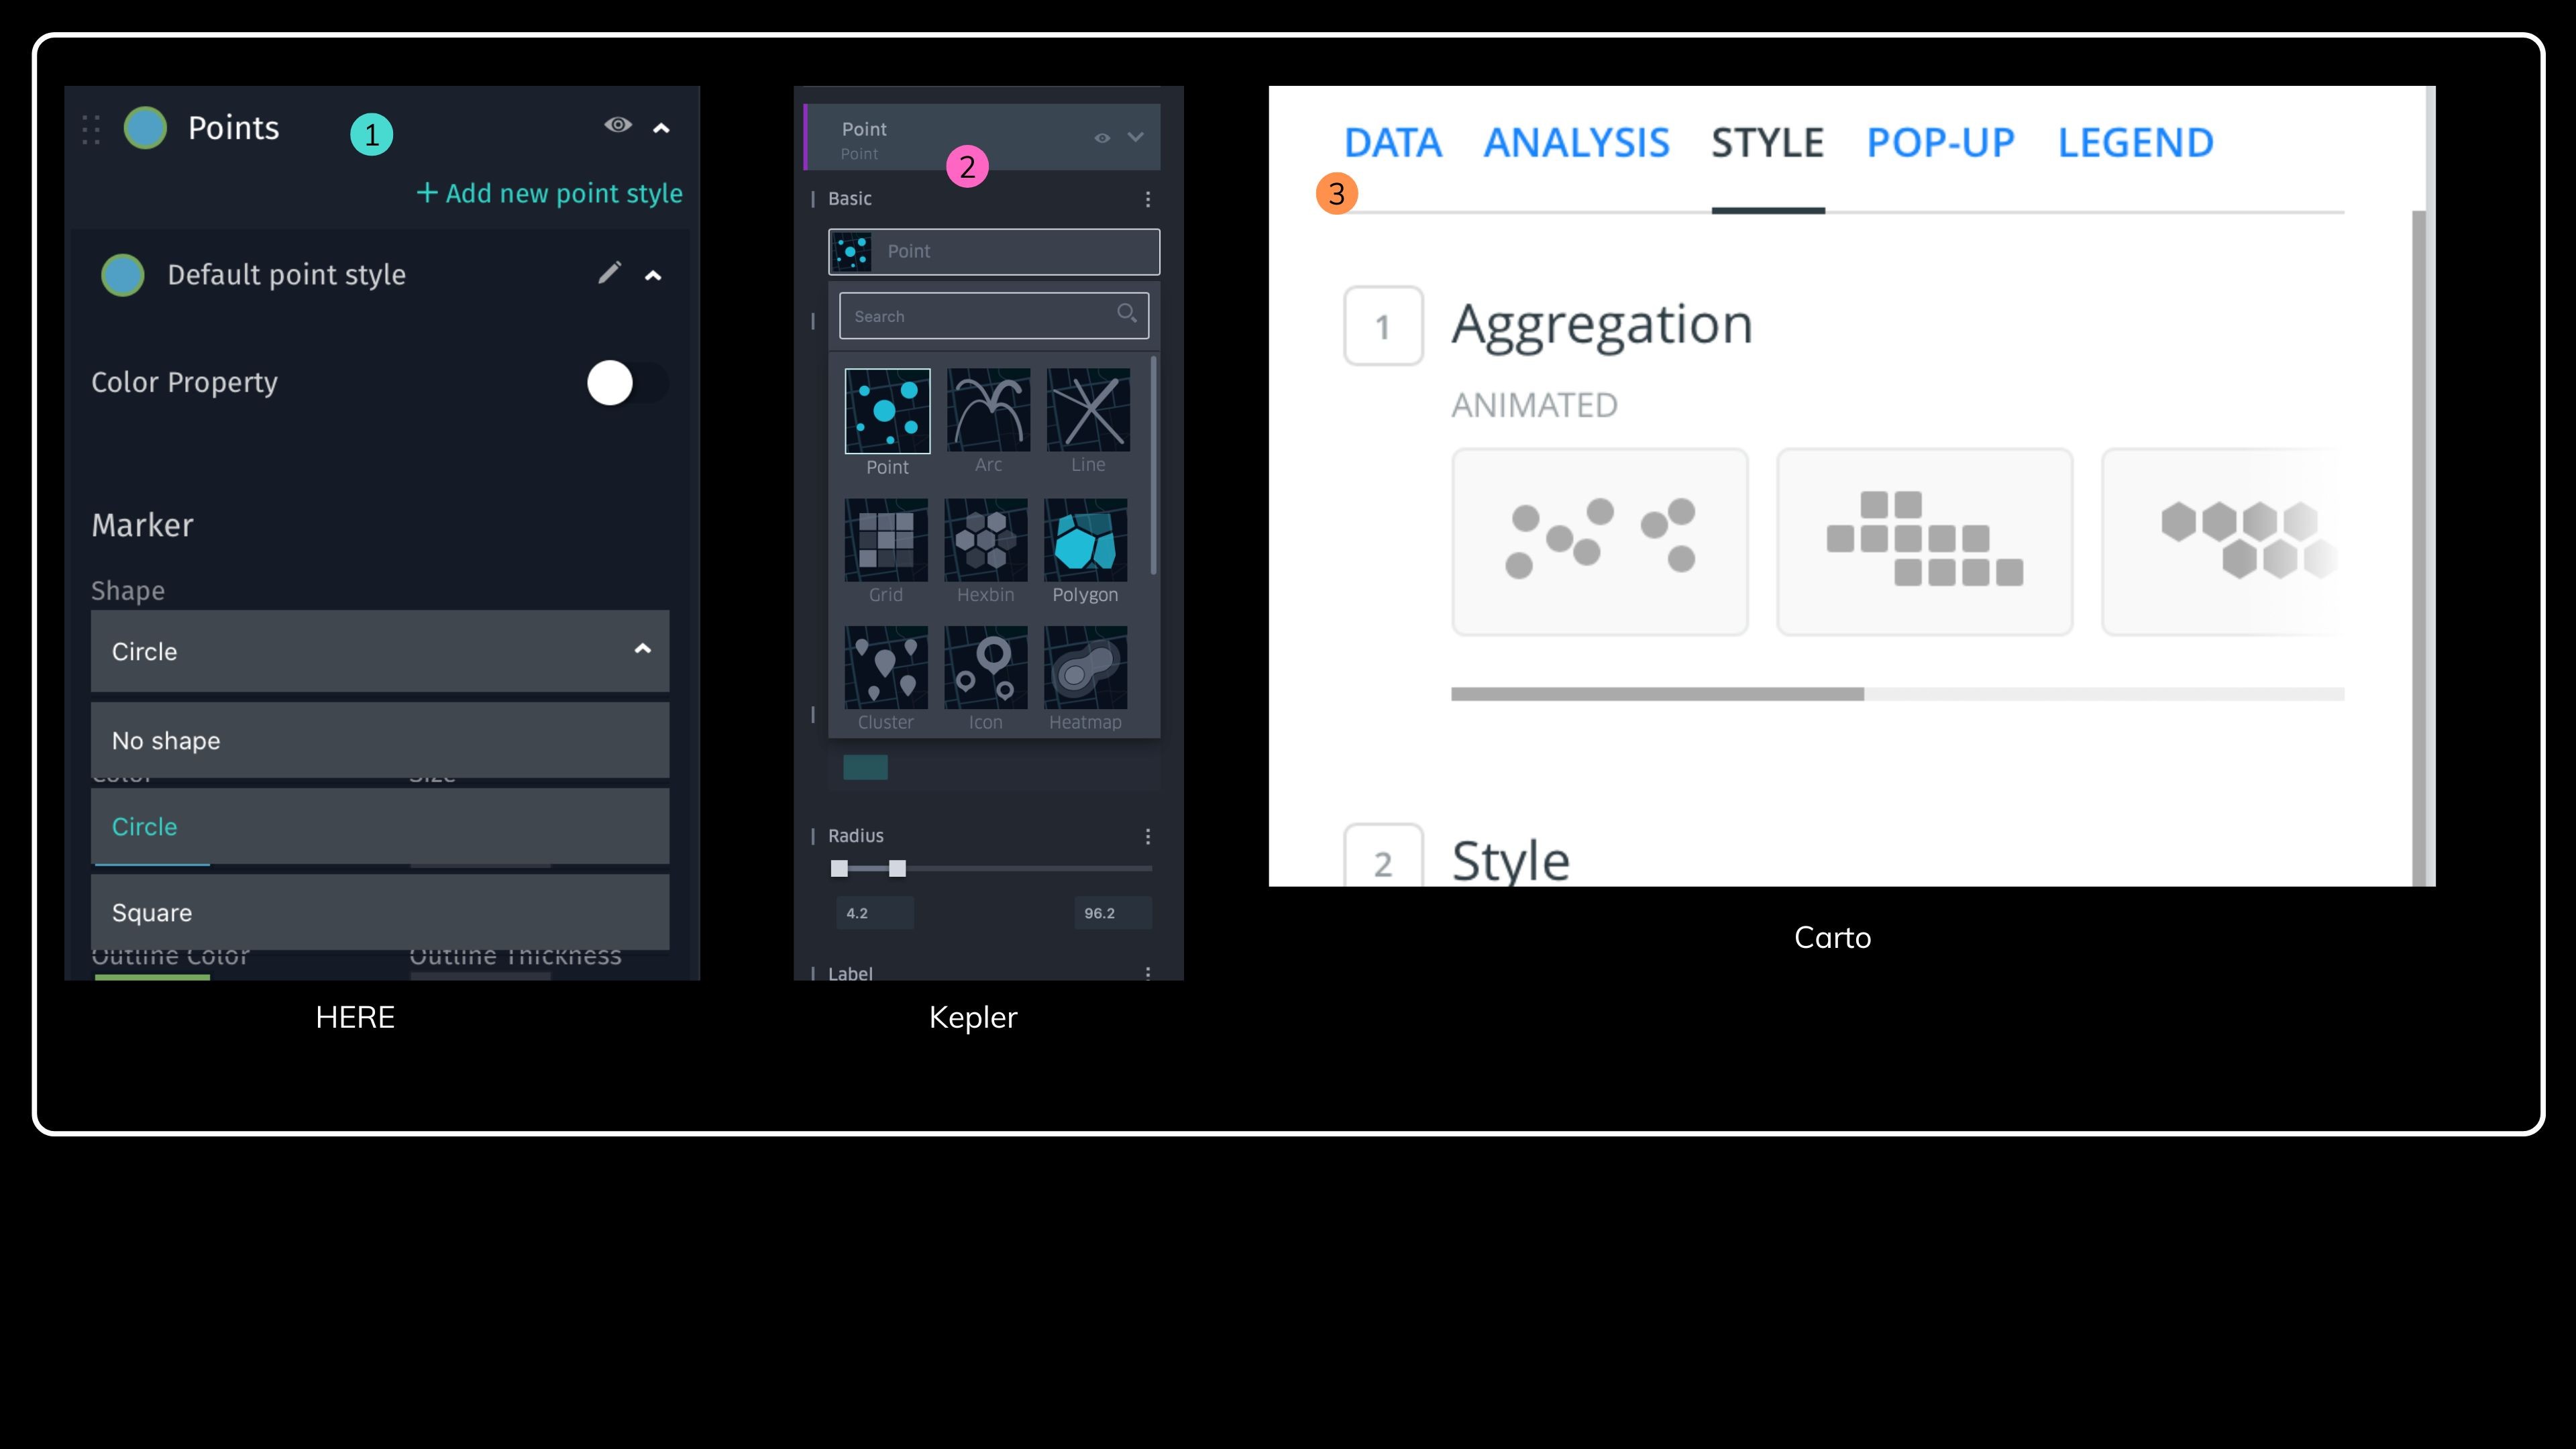
Detailed & vibrant display of shapes available.
Detailed & vibrant display of shapes available.
Showcases a catalog of styles available.
© User Research अनुसंधान
KYC
Types Of Users
HERE Studio's potential users span seven distinct groups, each with a different market size and a different reason to reach for a mapping tool. I mapped them to understand who I was really designing for.
Data Journalists
Ability to quickly add map visuals yo articles
Total: 1K | GIS Only: NA
GIS Analysts
An improved workflow from standard GIS software
Total: 10K | GIS Only: NA
Startup / SMB
A free platform to make simple maps for public & private use
Total: 900K | GIS Only: 156K
Enterprise
Institutional SLAs, private access to data & visualisation solution
Total: 4K | GIS Only: 1K
Engineer
A new map storage container & free solution for projects
Total: 586K | GIS Only: NA
Hobbyist
Hobbyist
Ability to customise their own solutions & visualisations
Total: 400K | GIS Only: 156K
Government / NGO
A hub for working with data & sharing it with the community
Total: 4.5K | GIS Only: NA
© User Research अनुसंधान
Information
Architecture
I reworked HERE Studio's information architecture from its existing structure, keeping what worked, cutting the redundancy, and reshaping the rest into a clearer map of the whole product, shown below.

© Introduction परिचय
HERE Technologies
Prototype
Designed in Sketch and prototyped in InVision for easy collaboration with the team, this is the high-fidelity, interactive version of the redesign, shown below.
Thank You!

HERE LiDAR Data
(02)
HERE STUDIO /
Map Analytical Tool
This one is special
Project Scope:
Redesign
Team Size:
1 Design Intern, 1 Design Lead, 3 Developers, 1 PM
Duration:
5 Months
Platform:
Desktop Web

© Summary सारांश
(WDX® — 01)
User Metrics
Outcome
Here is how the final solution moved the needle for the business
Retention
Adoption
Engagement
Time Reduction
© Introduction परिचय
(WDX® — 02)
HERE Technologies
Introduction
HERE Studio
HERE Studio (formerly Here XYZ) was a no-code tool from HERE Technologies for building and sharing interactive maps in the browser. During my internship, an early conversation with my mentor about the product's rough edges pointed us at its interface especially since HERE had just launched LUI 2.0, a new design language the tool hadn't adopted yet. My brief: find what wasn't working, and rebuild it in LUI 2.0.

© Challenge चुनौती
(WDX® — 03)
to overcome
The Objective
The objective had two layers. On the surface, the task was to migrate HERE Studio to LUI 2.0 the design language HERE had introduced only a few months earlier so the product would finally look and feel consistent with the rest of the catalogue. But a restyle alone would have wasted the opportunity. The real goal was to use that transition to fix the problems underneath: simplify how people work with layers and data, cut the redundancy across screens, and turn an empty, unguided first-run into something that actually helps a new user get started. In short not just make HERE Studio look like a HERE product, but make it work like one.

© User Research अनुसंधान
(WDX® — 04)
5 Steps
Approach
I worked through the project in five phases:
Analysis
Research
Benchmarking
Implementation
Testing.
I began by auditing the existing product screen by screen to map where it fell short. I then moved into research gathering input from HERE's own front-end team and from the people who actually use tools like this before bench-marking HERE Studio against its closest competitors to see where it stood. With a clear picture of both the problems and the landscape, moved into implementation, building from information architecture through low- and high-fidelity designs, and finally tested the result with users to see whether it held up. Each phase fed the next, so the final design was grounded in evidence rather than assumption.
© Ideation विचार
(WDX® — 05)
Thinking
Analysis
Confusing
(These are 2 separate buttons)
I started by walking through HERE Studio exactly as a new user would, screen by screen, noting everything that created friction.
The sign-in screen made a reasonable first impression it followed HERE's newer guidelines and creating an account was easy but the buttons were stretched far wider than they needed to be.
One of the two sign-in options was reserved for HERE employees without that being obvious.
Past sign-in, the project dashboard left large areas of negative space unused and split simple actions, like switching layouts, across separate controls.
The core map workspace was where the real problems lived. The left-hand control panel had the right idea surfacing only the options relevant at a given moment, with changes on the panel reflected live on the map but the placement of key actions like Layer and +Data was genuinely confusing.
Data uploads were quietly limited to certain file formats. The data section compounded this, the same information was repeated across three different tables in three different formats, and the interface mixed dark and light themes inconsistently.
Individually these were small things; together they made a capable tool harder to use than it needed to be.
© Comparison तुलना
(WDX® — 06)
5 Tools
Competitor Analysis
To understand where HERE Studio stood, I benchmarked it against four of its closest competitors, Kepler, Mapbox, ArcGIS, and Carto.
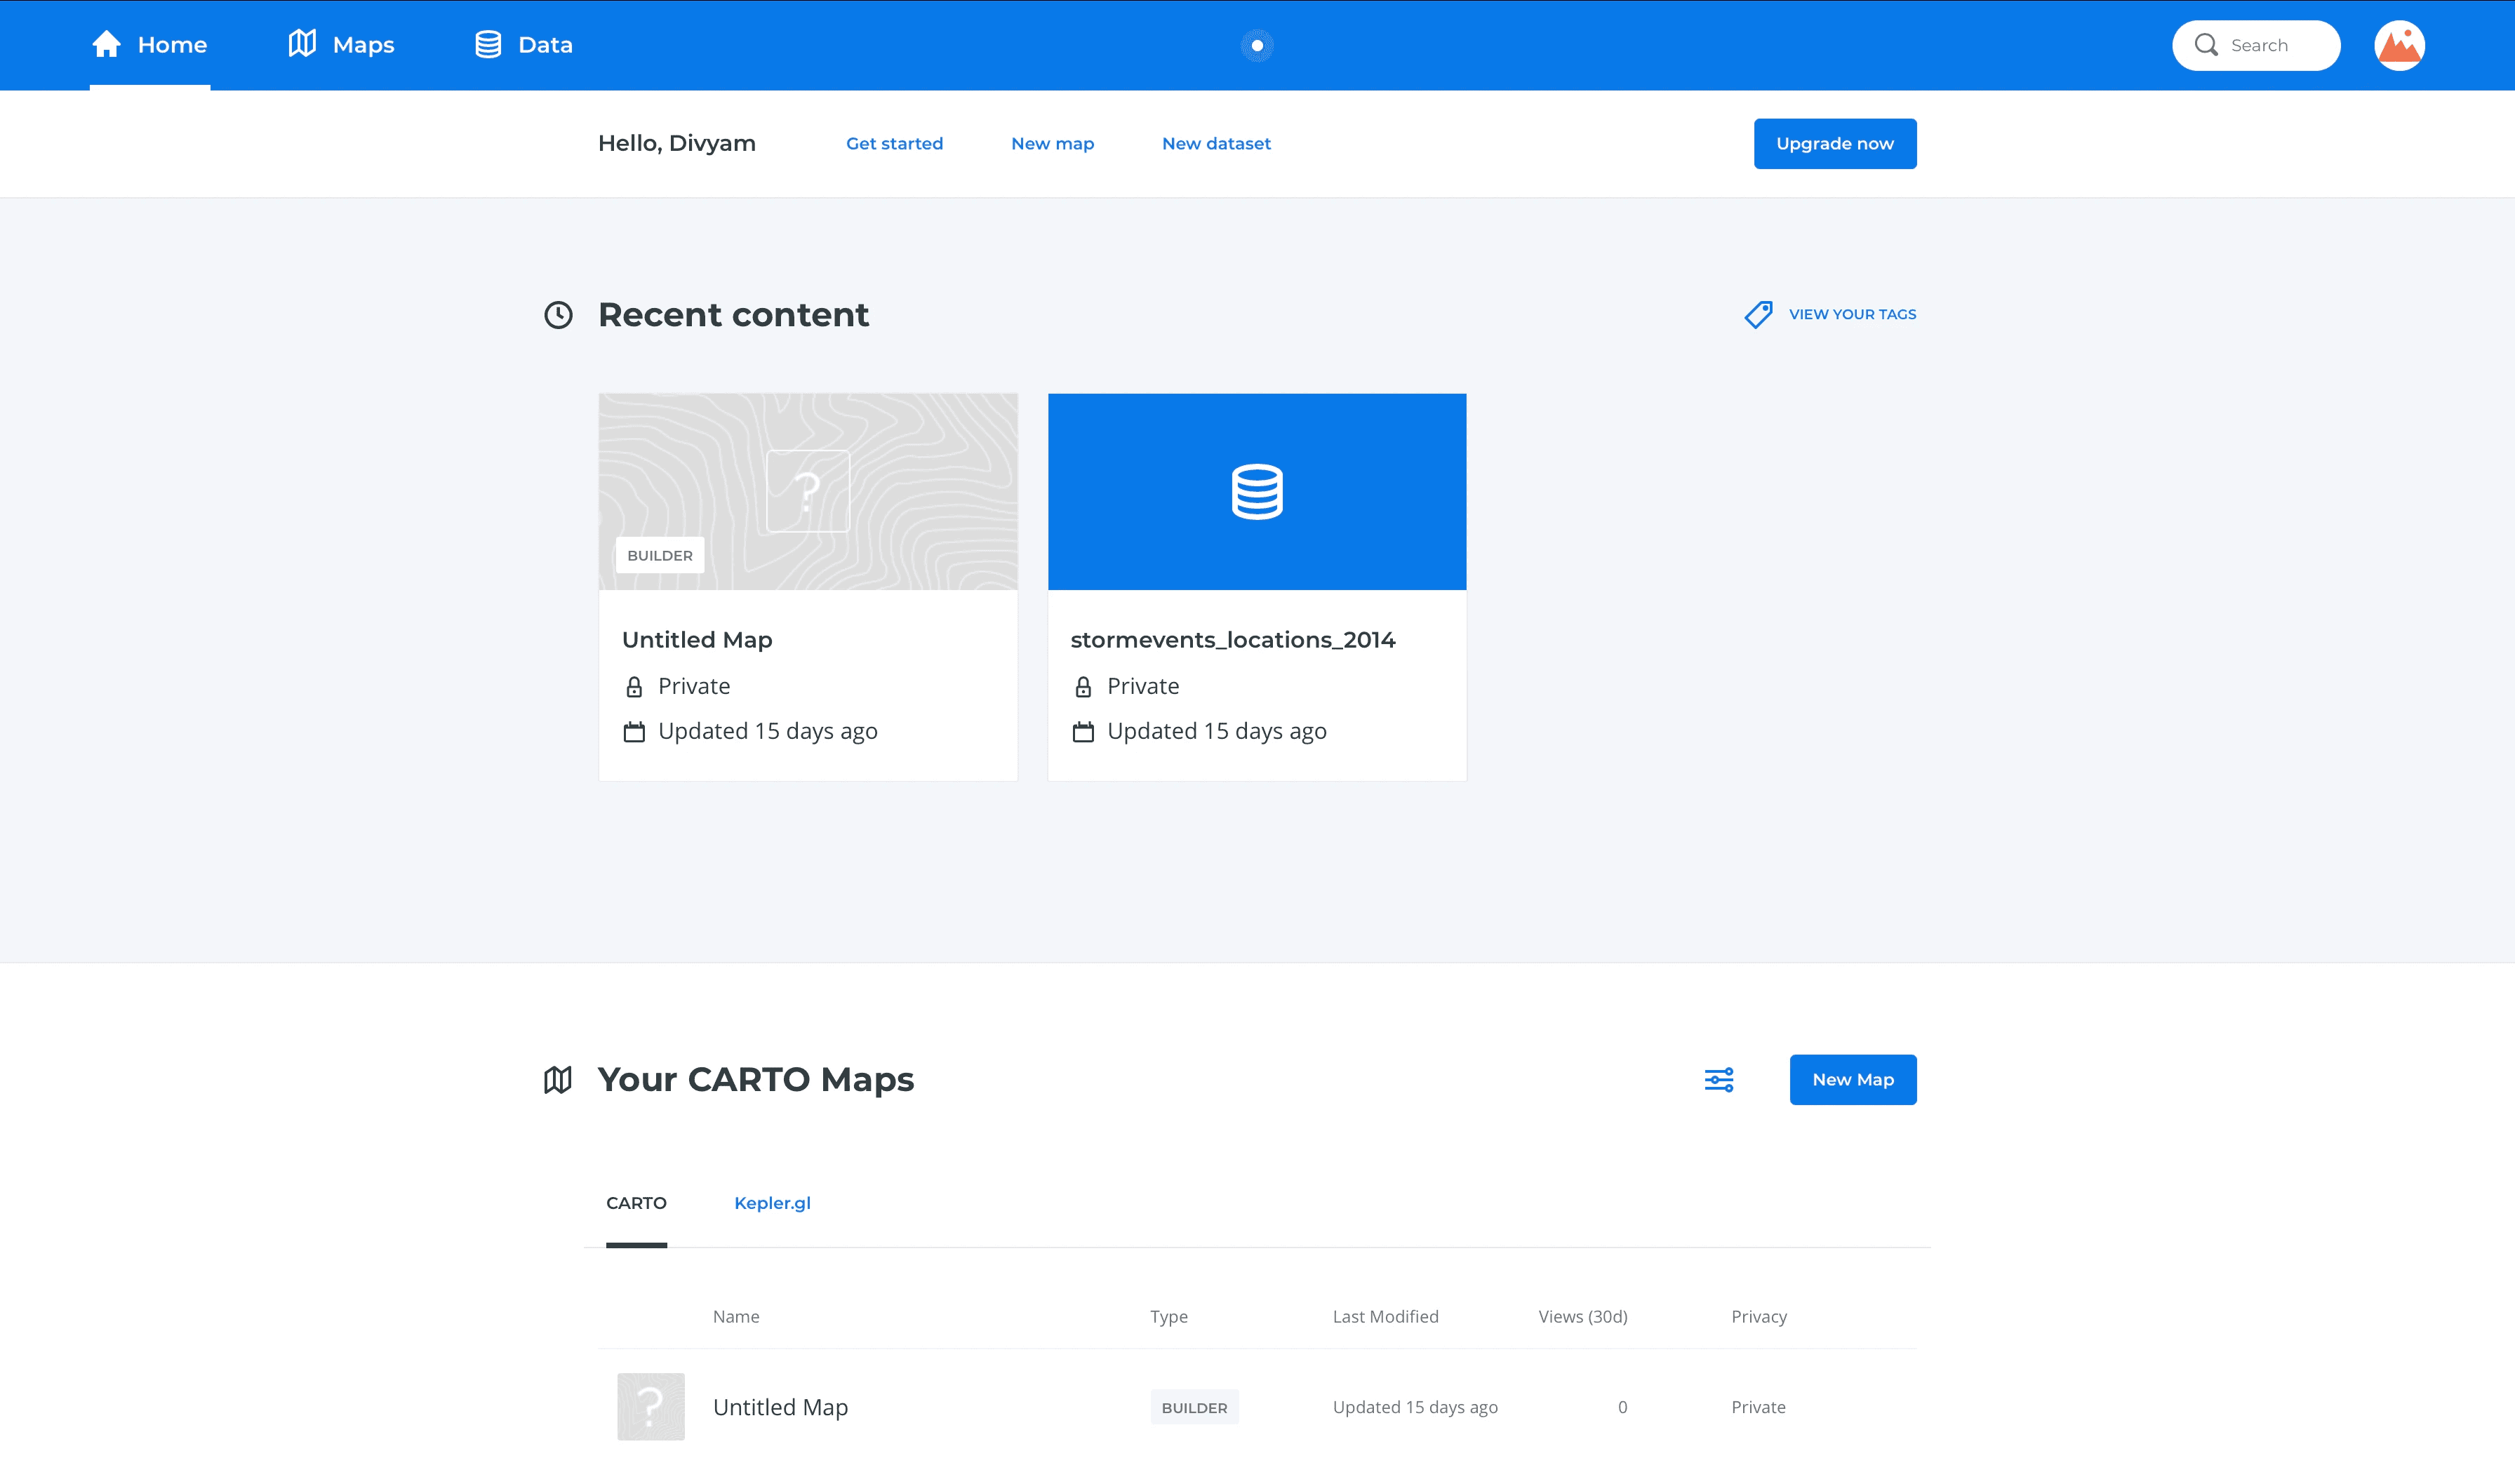
I started with the most basic question: how long does it take to actually start working? I counted the number of clicks each tool needed to reach its map canvas, the main screen, where the real work happens. Those paths are shown below: for each tool, the screens you pass through, arranged in ascending order up to the map canvas, so the difference in how quickly you can get to the heart of each product is visible at a glance.
From there I compared the tools along two axes. The first was functional: a feature-by-feature comparison of what each could and couldn't do, spanning data handling, filtering,
customization, sharing, and search.
The second was qualitative: how each tool felt to use, scored across things like toolbar alignment, in-context prompts, ease of use, and whether it leaned on a dark or light interface. I went deeper on the areas that mattered most, the home page, sign-up, dashboards, layout, filtering, color, and styling, studying how the strongest competitors handled each.
The comparison made clear where HERE Studio was already competitive and, more usefully, where it fell behind, especially around (getting started / onboarding / the specific area which was found weakest), which is exactly where I concentrated the redesign.








Carto
Mapbox
Kepler
HERE
ArcGIS
1
2
3
4
1
2
3
4
1
2
3
1
2
3
4
5
1
2
3
4
5
Number Of Clicks
Functional Analysis

Qualitative Analysis

Home Page
These are the first pages which the user sees after entering the URL. Importance level is very high as this page sets the scene, it is recommended that business firms use their iconic colors, fonts and logos to maximum extent to make them stand apart and make an unforgettable impression on the user.
Sign up Page
1
HERE
4
Carto
2
Mapbox
3
ArcGiS
Movement from dark to light theme is straining for the eyes.
Function like sorting in table is not evident.
Table appears to be long & densely packed with data.
3rd party sign up is available. Provides useful info. Good balance of branding & functionality. Requires 3 inputs.
No 3rd party sign up option.
Very minimalistic setup.
But just simplicity is not enough.
Requires 6 inputs.
No 3rd party sign up option.
Provides useful info with infographics
Needs to work on aesthetics.
Requires 3 inputs.
Account Dashboard
1
HERE
4
Carto
2
Mapbox
This is more of a print form approach than a digital web form.
Good setup and layout.
Use of different colors to indicate level of storage used. Sufficient amount of info is provided.
Good use of hover response.
Detailed info is not provided.
The big start button is
overshadowing other elements.
Dashboard
1
HERE
4
Carto
2
Mapbox
Macro space is less.
Footer is missing.
Time of edit is not useful data.
Visual weight of letters is insufficient.
Import data from partner service directly.
Centre aligned.
Using 3 colour rule. (blue, white, black)
Footer is present.
Thumbnail is too small.
Footer is missing.
Good use of hover response.
Does not highlight the page you're on.
Map Canvas Layout
1
HERE
4
Carto
2
Mapbox
Uses card layout.
Few features are not evident.
Minimum number of elements used.
Neat & balanced UI = less strain.
Uniquely uses both sides of the screen when required.
Uses card layout.
Regularly uses hover to show prompts.
Has most number of elements, densely but neatly packed, uses breadcrumbs so that user is not overwhelmed looking at elements.
3
ArcGIS
5
Carto
Functions are classified in categories.
Dropdowns are used extensively.
Hover is used to illuminate few functions.
UI is not very engaging.
Very well laid setup.
2-3 non-priority functions illuminate when hovered upon.
Prompts are used extensively.
Layout Analysis
2
Home
1
Search
3
Zoom in-out
Filter
2
Carto
1
Kepler
All the options are displayed one after the other, the numerical variables use slider and strings simply select & deselect.
Type of variable is automatically detected & accordingly the slider is activated or subcategory is opened. If its a float or integer then slider, if its a string then subcategory.
Filter
1
HERE
2
Mapbox
The system doesn't detect the type of variable. User gets to choose the feature from a dropdown but the value to be compared with is to be typed & accepts all value which it should not.
User has the option to not only filter by features from the uploaded dataset but also components.
Color
1
Carto
2
Mapbox
User can use auto style which allots color with respect to featuresor can customise accordingly. The interface is user-friendly.
User has the option to customise every minute details like font style & color.User is recommended a combination of colors.
Color In Kepler
1
Kepler
Kepler does everything what Carto does but in a cleaner way.
According to Hick's law, number of options to select at a time is proportional to load on user.
Color
1
HERE
2
ArcGis
User has the option to use auto style, but there are no color palettes. There is an option to add attribution.
Everything else dims down to highlight the color box when its selected. Steps are mentioned.
Number of color palettes to choose from.
Attribution is followed by a dropdown of options.
Style
1
HERE
2
Kepler
3
Carto
Has only 3 shapes available.
Can customise size.
Detailed & vibrant display of shapes available.
Showcases a catalog of styles available.
© User Research अनुसंधान
(WDX® — 07)
KYC
Types Of Users
HERE Studio's potential users span seven distinct groups, each with a different market size and a different reason to reach for a mapping tool. I mapped them to understand who I was really designing for.
Data Journalists
Ability to quickly add map visuals yo articles
Total: 1K | GIS Only: NA
GIS Analysts
An improved workflow from standard GIS software
Total: 10K | GIS Only: NA
Government / NGO
A hub for working with data & sharing it with the community
Total: 4.5K | GIS Only: NA
Startup / SMB
A free platform to make simple maps for public & private use
Total: 900K | GIS Only: 156K
Enterprise
Institutional SLAs, private access to data & visualisation solution
Total: 4K | GIS Only: 1K
Engineer
A new map storage container & free solution for projects
Total: 586K | GIS Only: NA
Hobbyist
Ability to customise their own solutions & visualisations
Total: 400K | GIS Only: 156K
© User Research अनुसंधान
(WDX® — 08)
Information
Architecture
I reworked HERE Studio's information architecture from its existing structure, keeping what worked, cutting the redundancy, and reshaping the rest into a clearer map of the whole product, shown below.
© Result परिणाम
(WDX® — 09)
Overhauled
Prototype
Designed in Sketch and prototyped in InVision for easy collaboration with the team, this is the high-fidelity, interactive version of the redesign, shown below.